|
|
|

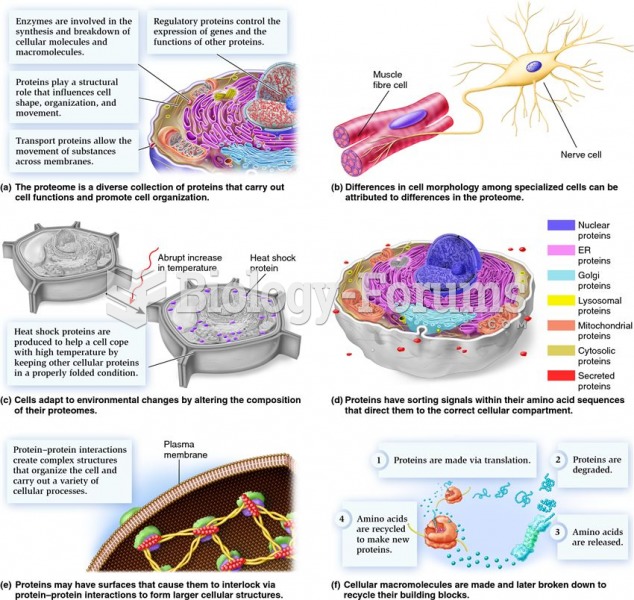 Proteomes and their relationship to cell structure, function, and organization.
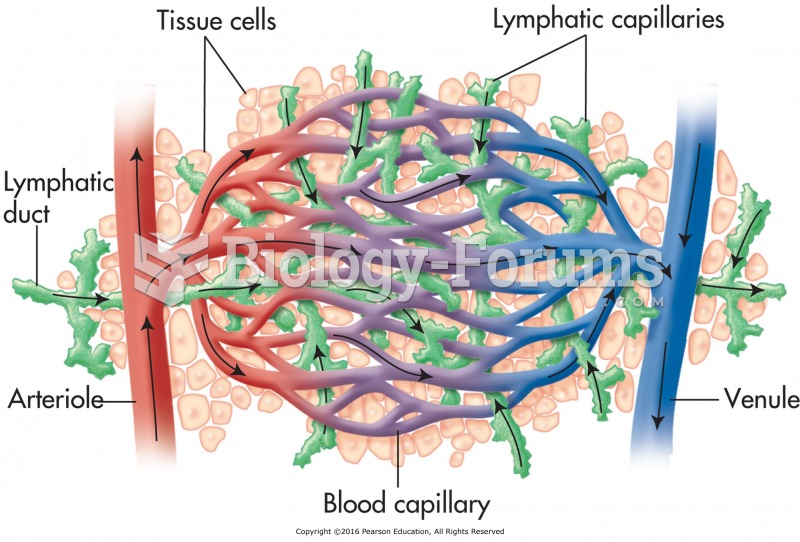 Relationship between blood and lymph capillaries.
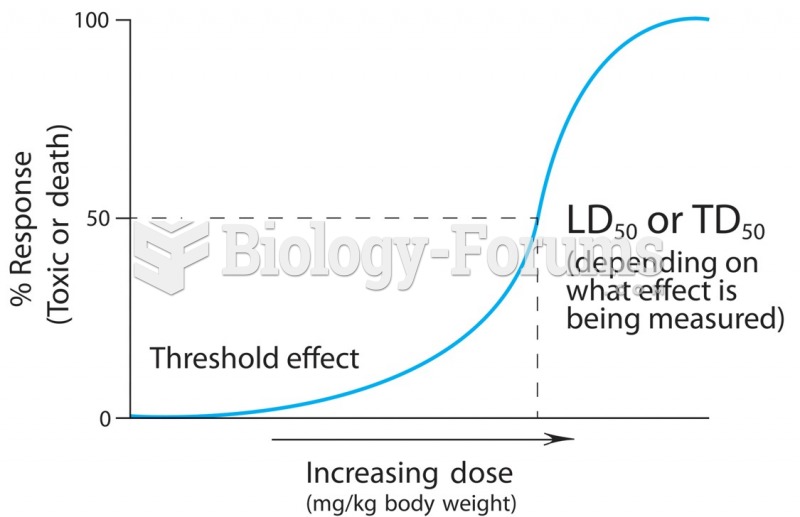 A dose-response curve describes the relationship between the quantity of the chemical entering the ...
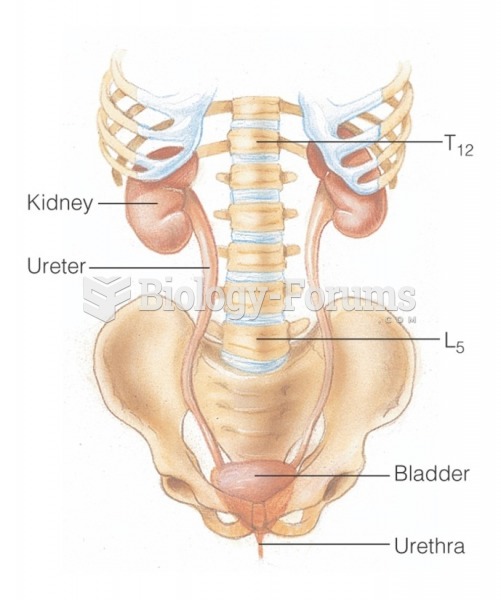 The urinary system: Relationship of the kidneys to the vertebrae
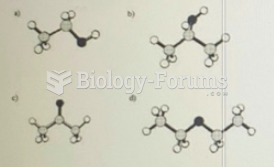 Ethanol has the molecular formula C2H6O. Which ball and stick model shown above represents ...
 Change in the frequency of a lethal recessive allele, a