|
|
|

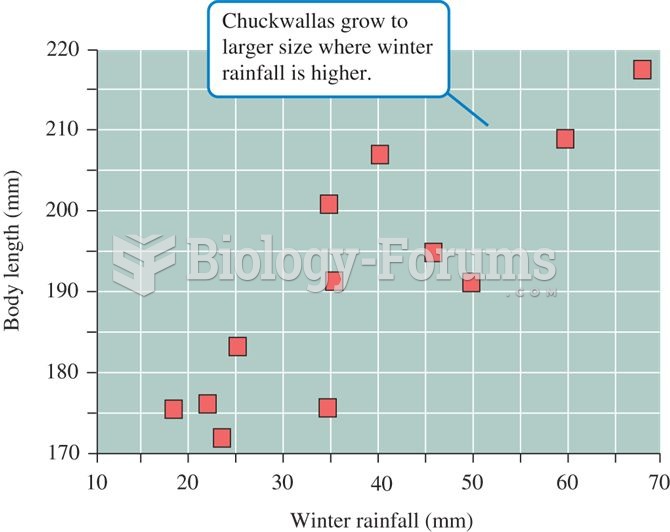 Relationship between winter rainfall and chuckwalla, Sauromalus, size
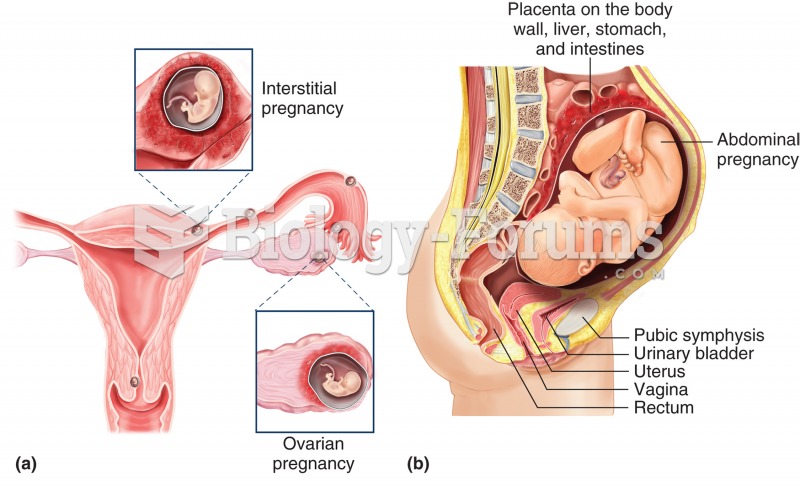 Ectopic pregnancies. (a) An ectopic pregnancy may occur in any of the locations shown. Interstitial
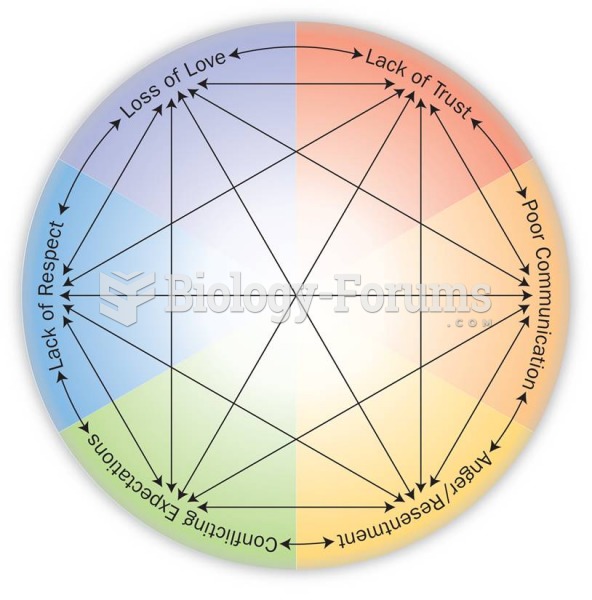 The Circle of Relationship Issues and Sexual Problems
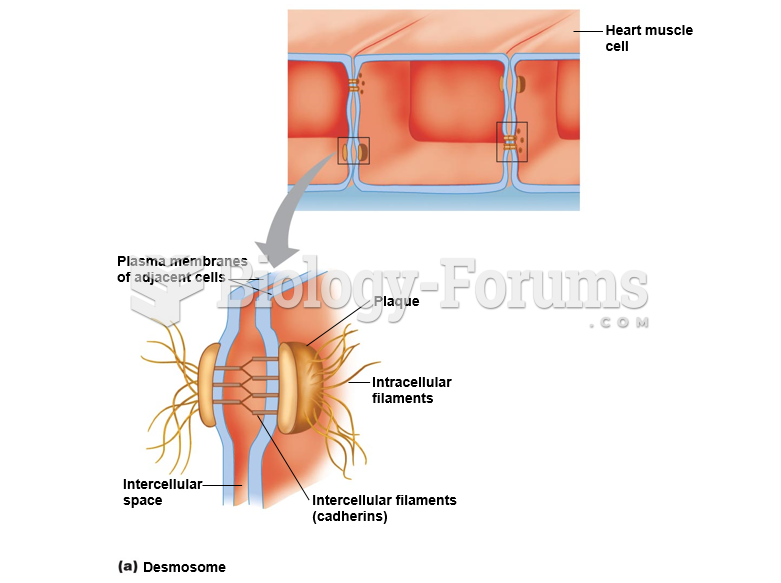 Desmosomes and gap junctions, as shown in heart muscle: Desmosome
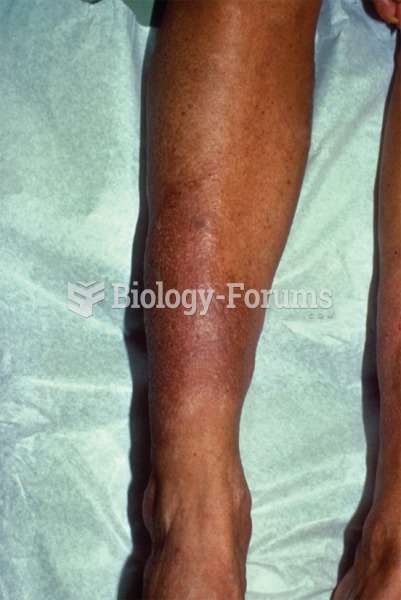 Dermatological changes with myxedema can occur behind the eyes or in the lower leg, as shown here.
 The effect of selection on allele frequency