This topic contains a solution. Click here to go to the answer
|
|
|

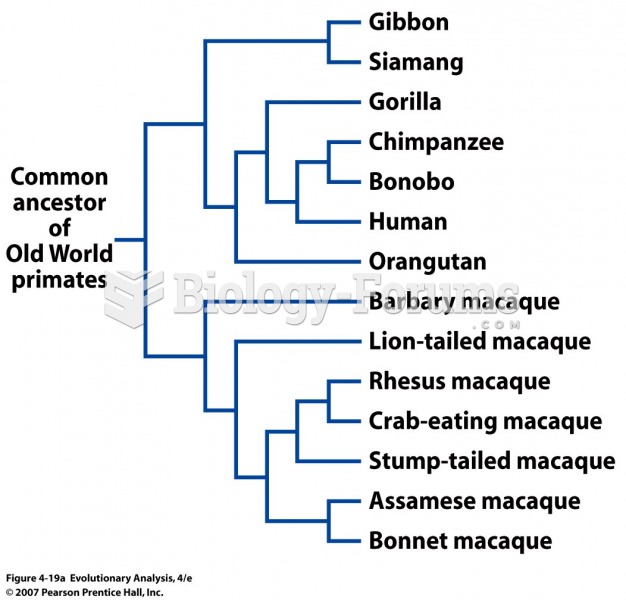 Phylogenies showing the relationships of some Old World primates
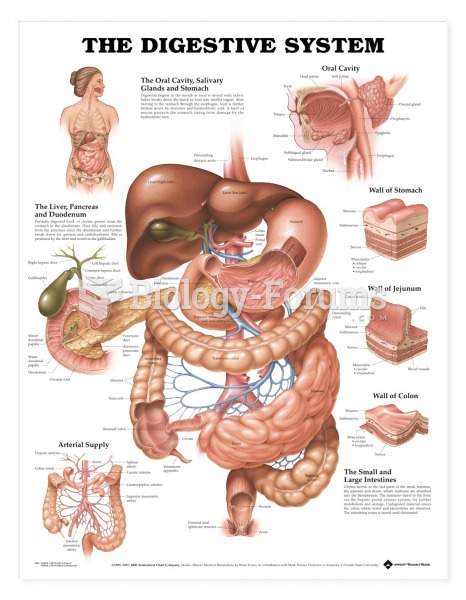 Anatomical Charts Digestive System
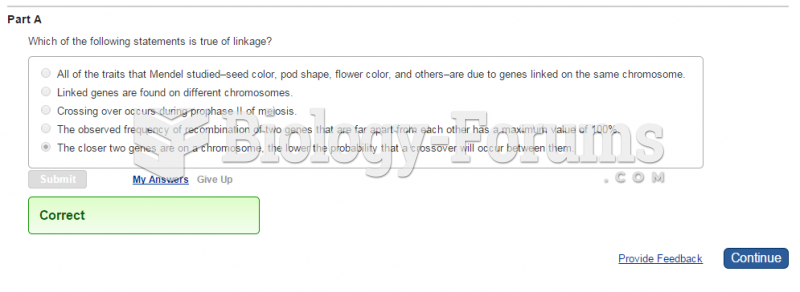 Which of the following statements is true of linkage?
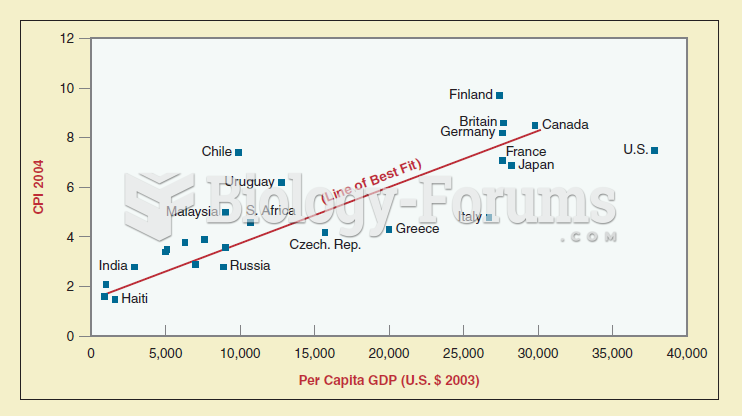 Scattergrams are a mechanism used by political scientists to show patterns and relationships among v
 Sibling relationships can be intense, in terms of both having fun together and engaging in conflict.
 Cladogram showing genetic distances and relationships between human populations