An analyst wishing to show the fluctuations in coffee consumption by month over the past two years should probably use a:
a. grouped bar chart.
b. pie chart.
c. line chart.
d. stratum chart.
e. divided bar chart.
Question 2
Which of the following is FALSE about charts in the research report?
a. The pie chart can be used to depict changing trends over time.
b. The line chart is a two-dimensional chart that is particularly useful in depicting dynamic relationships such as time-series fluctuations of one or more series.
c. The stratum chart is in some ways a dynamic pie chart in that it can be used to show relative emphasis by sector and how the relative emphasis is changing with time.
d. The stratum chart is essentially a set of line charts whose quantities are aggregated or a total that is disaggregated.
e. A pictogram is a variation of a bar chart.

 7 month history of gradual, painless swelling and redness of both eyes
 The skullcap from Trinil, Java is the type specimen for H. erectus and is about 900,000 years old.
 The Upper Cave at Zhoukoudian yields ages of about 25,000 years for Homo sapiens.
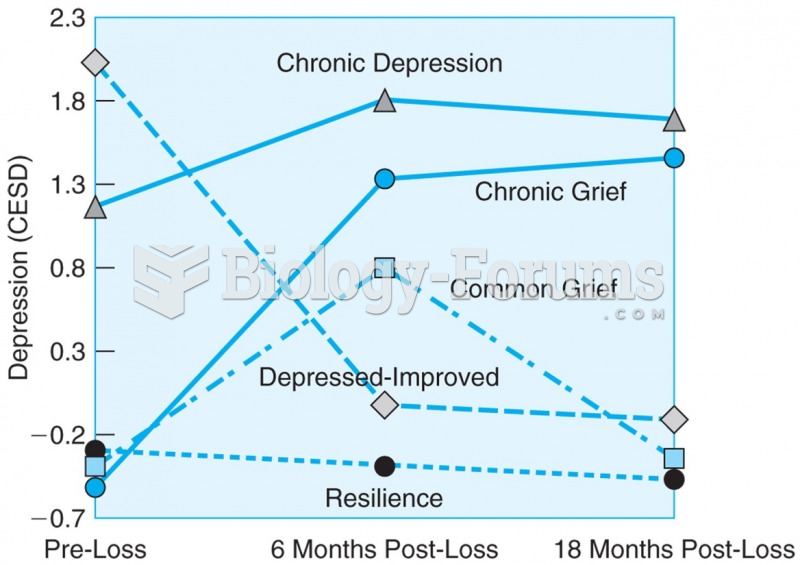 Bereaved spouses studied before loss, at the time of loss, and 18 months after loss show five ...
 Past Vegetation
 Serum protein electrophoresis gel of 10 sera. Lanes 1, 2, 3, 5, 8, and 9 show evidence of an ...