This topic contains a solution. Click here to go to the answer
|
|
|

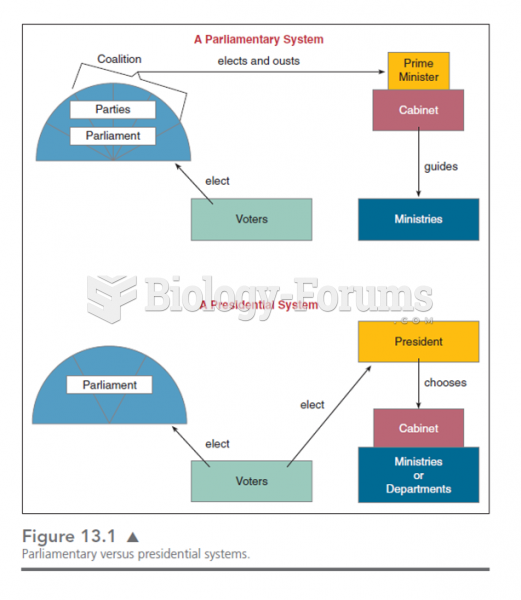 This chart shows the various lines of responsibility and how they differ in presidential and parliam
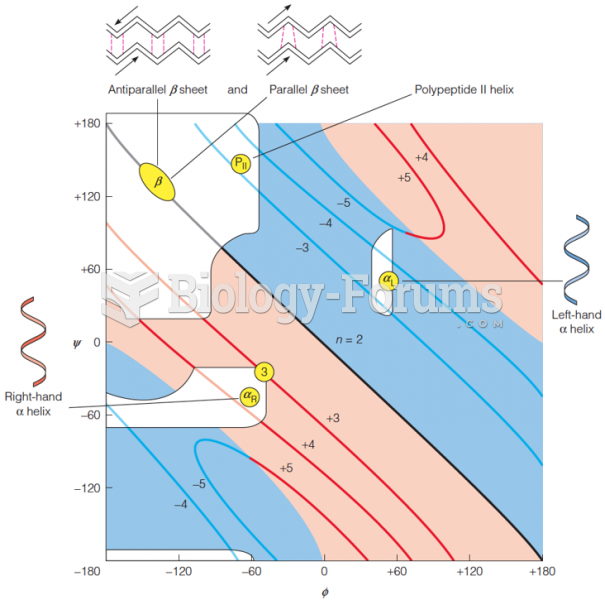 Ramachandran plot
 This graph illustrates how unattached older adults are poorer than their peers who live in families
 A(n) _____ is a spur-of-the-moment question. Fill in the blank(s) with correct word
 Illustrated correlation between the Mendelian postulates of unit factors
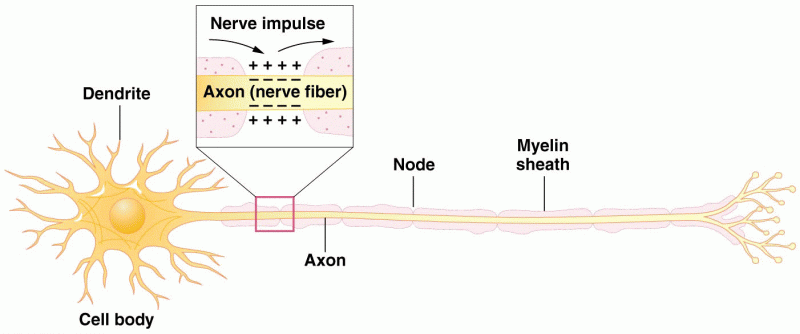 A nerve cell (neuron) has extensions called dendrites