|
|
|

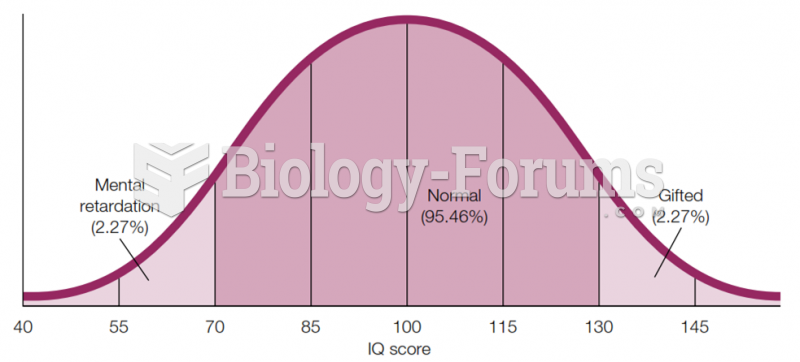 Bell Curve for Intelligence IQ scores for a population-based sample usually fall into this kind of
 The Distribution of Dominant and Minority Groups
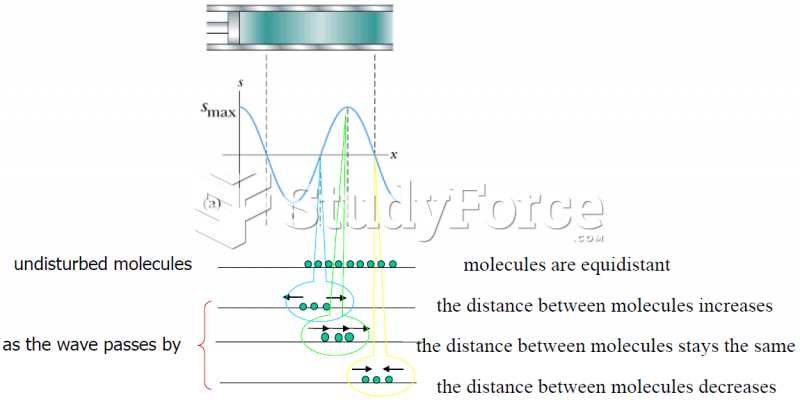 Graphical representation of a sinusoidal longitudinal wave
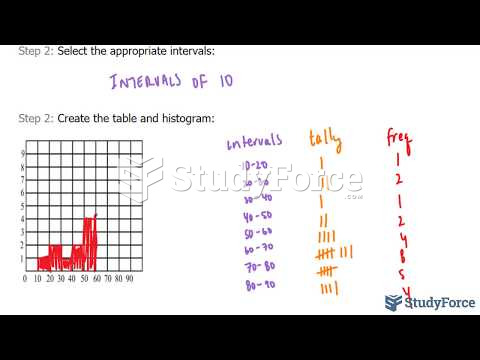 How to create a frequency table and histogram from raw data
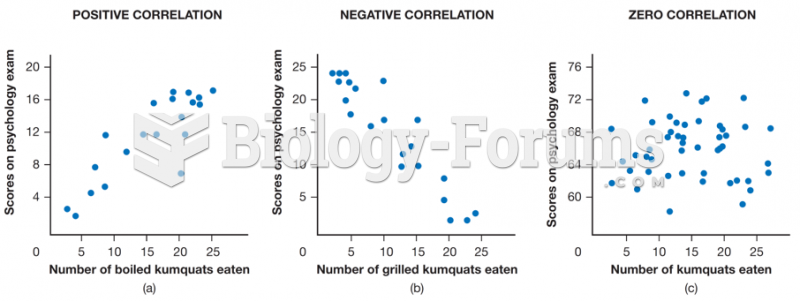 Correlations between scores on a psychology test and number of boiled kumquats eaten per month
 Clumped distribution of schooling squirrelfish