|
|
|

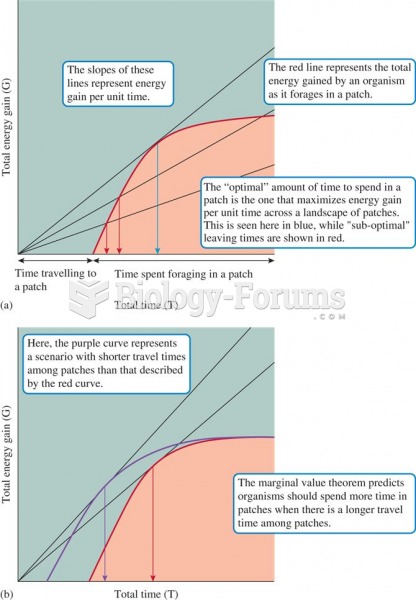 A graphical representation of the marginal value theorem.
 Role of alternative splicing in the perception of sounds of different frequency
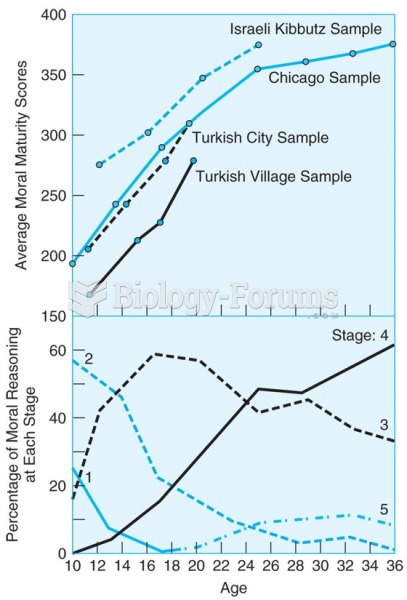 The upper panel shows that scores of four diverse samples of boys on a moral reasoning test show a ...
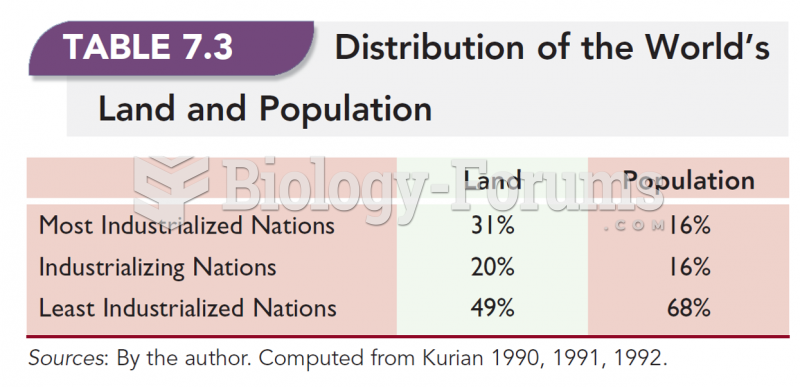 The Distribution of the World's Land and Population
 Distribution and Forms of Precipitation: Snow
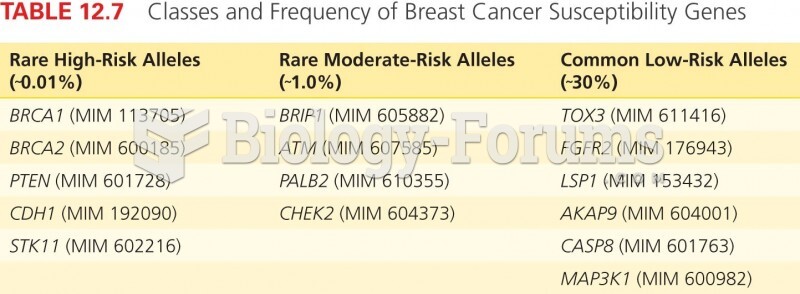 Classes and Frequency of Breast Cancer Susceptibility Genes