|
|
|

 Karst Distribution
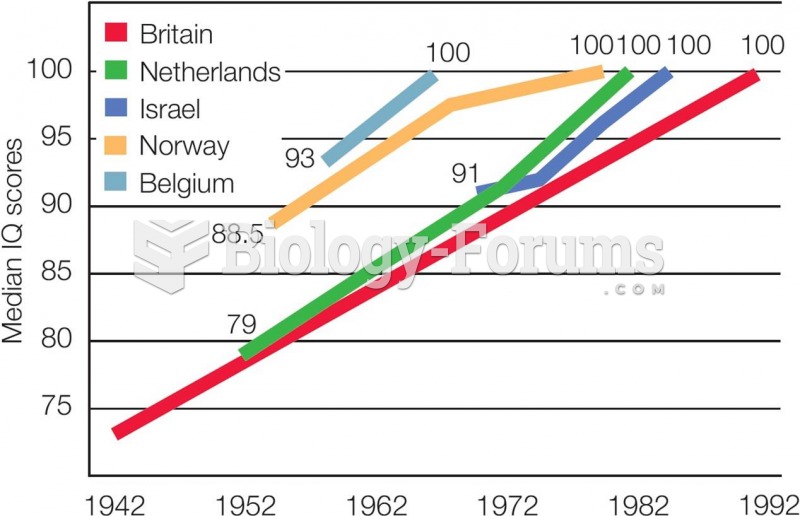 Flynn Effect IQ scores have risen across developed countries in recent decades. Source: Flynn (199
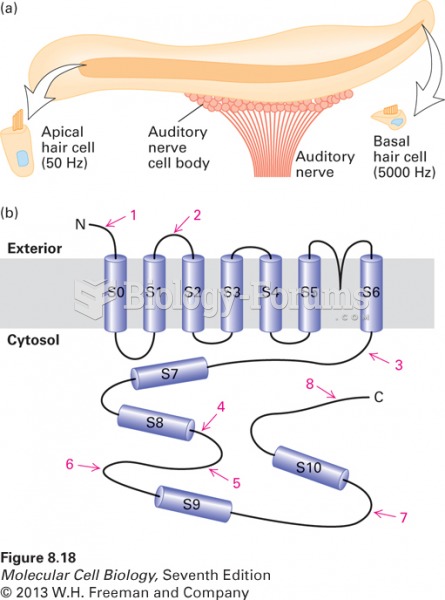 Role of alternative splicing in the perception of sounds of different frequency
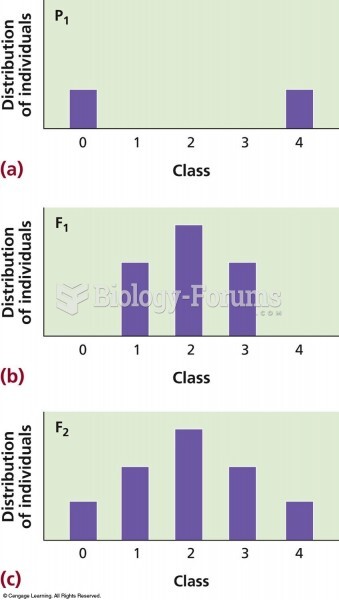 Frequency diagrams of skin colors. (a) Skin color distribution in the parents falls into two discont
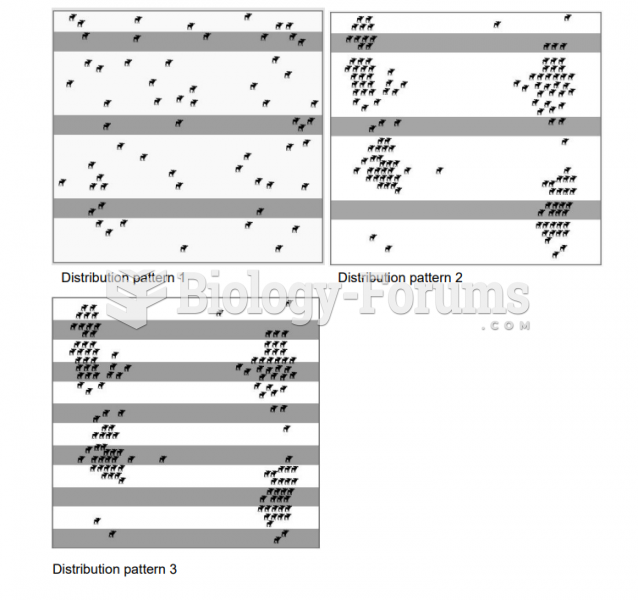 Distribution Patterns and Population Size Estimates (Bio 30)
 Genetic drift of an allele frequency