|
|
|

 Close-up of the underside of a gecko's foot as it walks on vertical glass
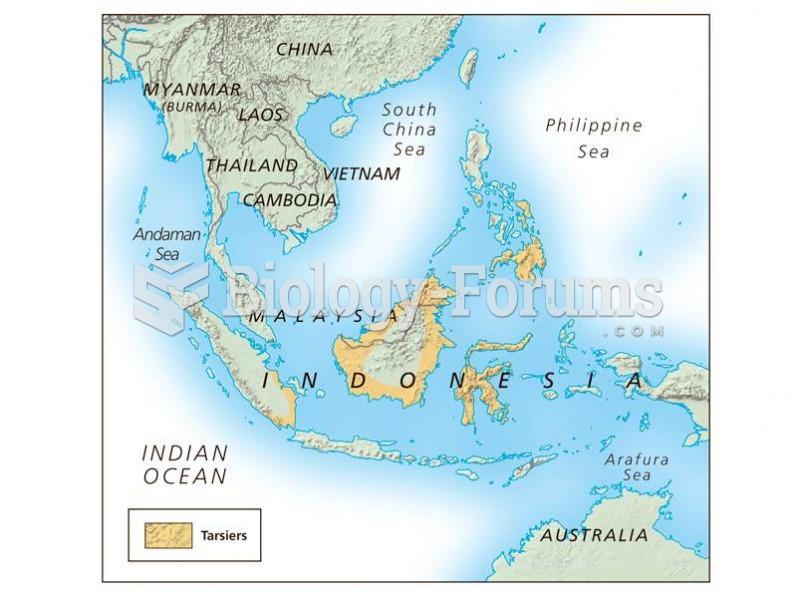 The distribution of the tarsier.
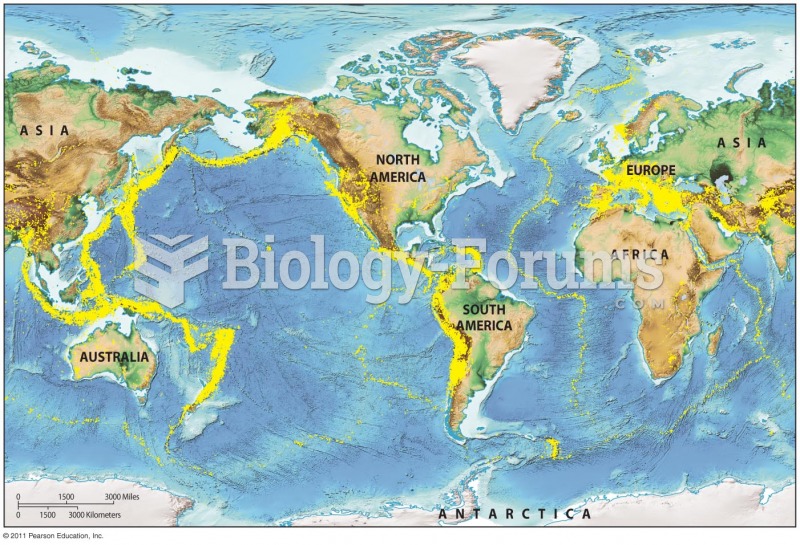 Global Distribution of Earthquakes
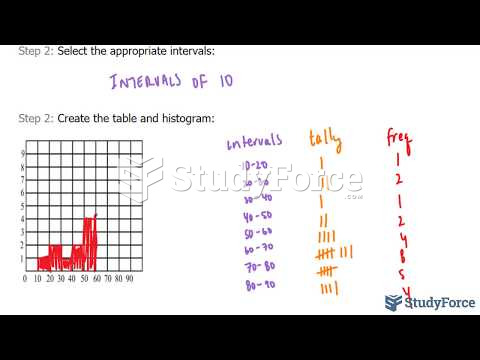 How to create a frequency table and histogram from raw data
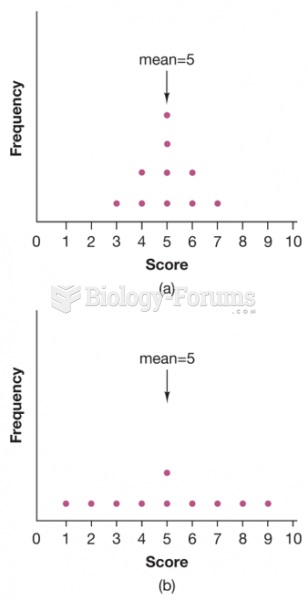 . In which distribution is the mean more “typical” of all scores?
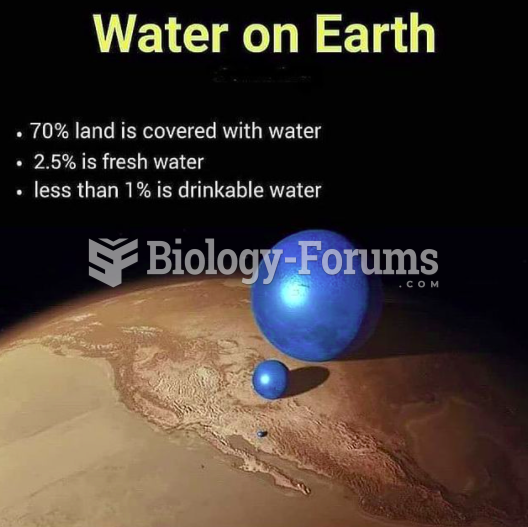 The Distribution of Water on Earth