This topic contains a solution. Click here to go to the answer
|
|
|

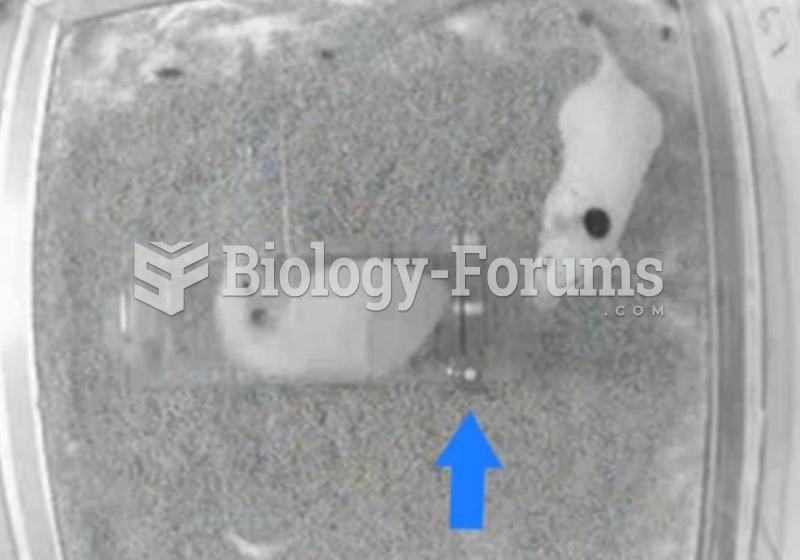 Rodents Show Empathy-Driven Behavior
 Acromegaly. Acromegaly is a metabolic disorder in which excessive amounts of growth hormone are secr
 Plant Diagram
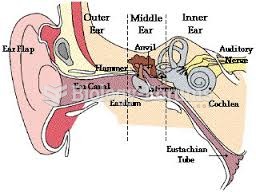 Human Ear diagram
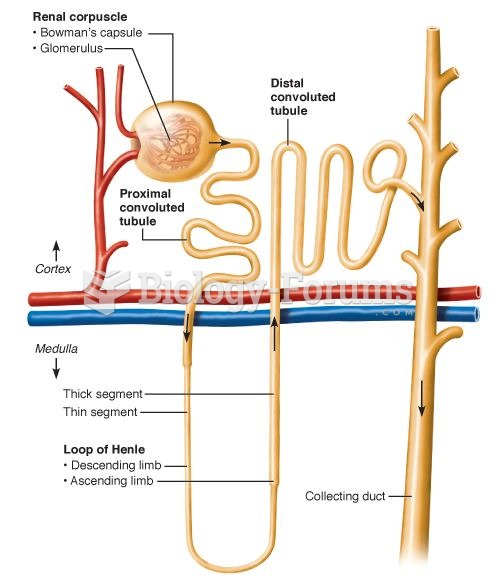 Diagram of a Nephron
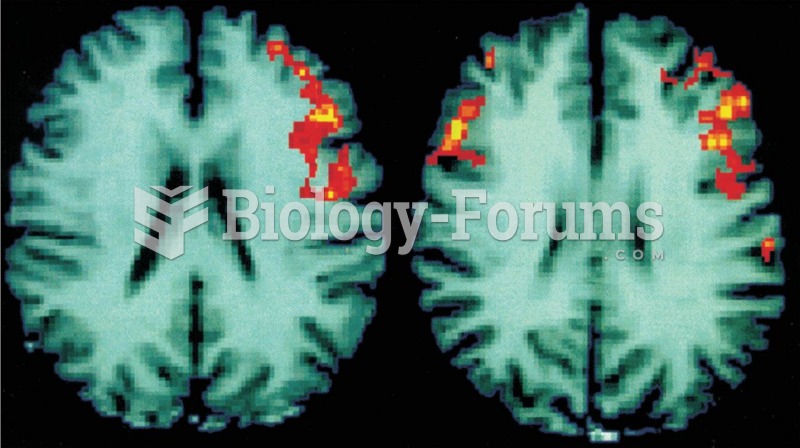 Functional MRI Scans These scans of human brains show localized average increases in neural activity