|
|
|

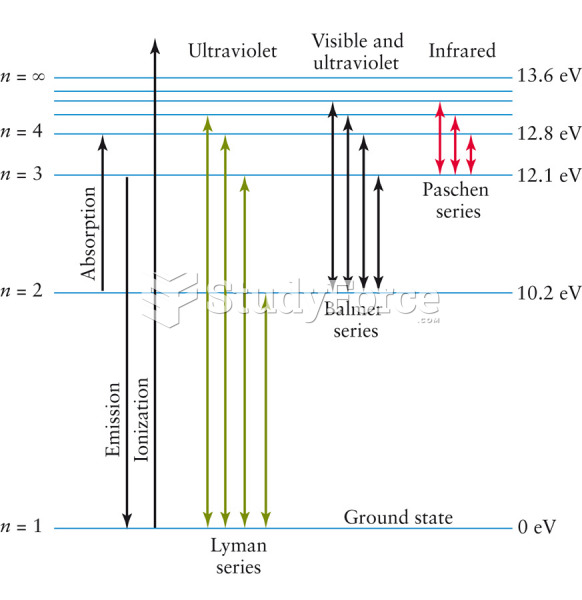 Energy Level Diagram of Hydrogen
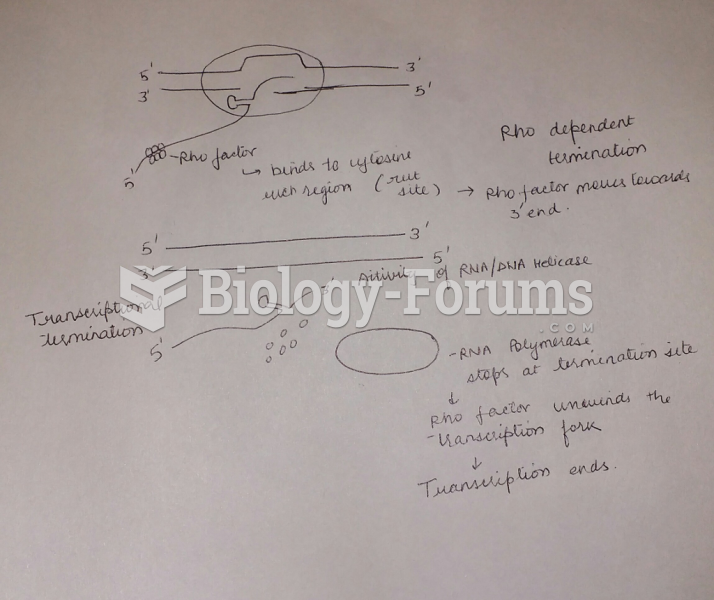 Draw and label a diagram and explain how a factor-dependent transcription (rho-dependent) terminator
 These photos show a rat burying a test object from which it has just received a single mild shock.
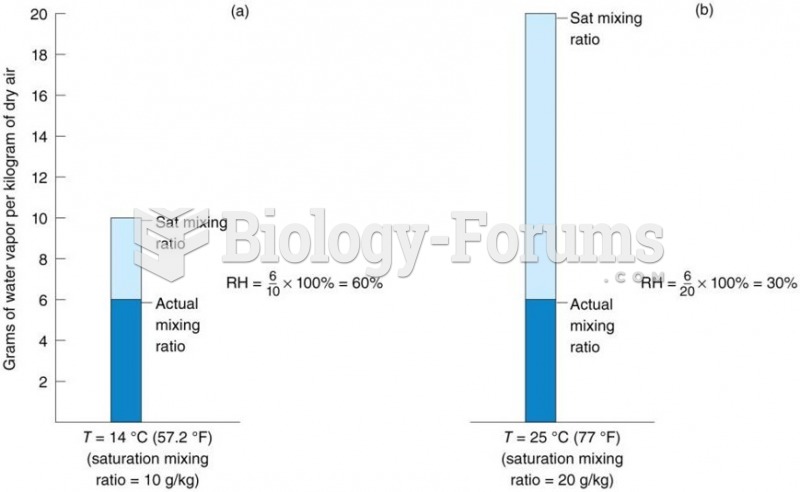 The relationship between RH and temperature.
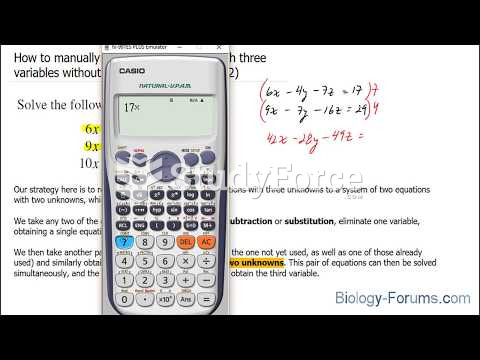 How to manually solve a linear system with three variables without matrices (Question 1 of 2)
 Relationship between birth weight and mortality in humans