This topic contains a solution. Click here to go to the answer
|
|
|

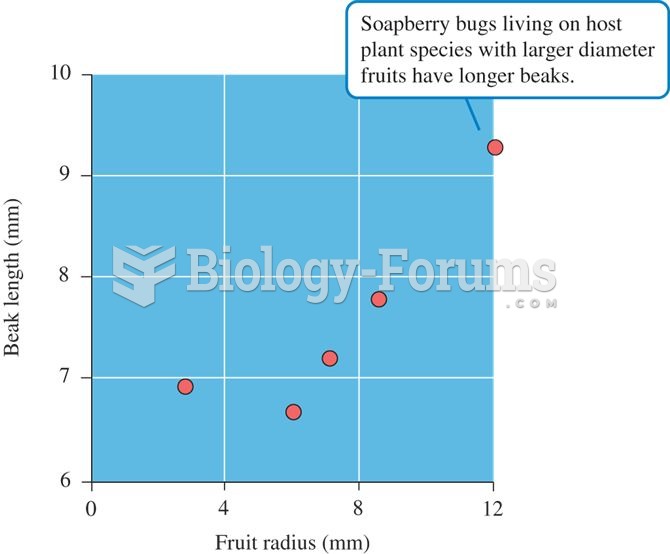 Relationship between fruit radius and beak length in populations of native and introduced species of
 Diagram of a cell nucleus
 A pair of humpback whales lunge feeding through a bait ball
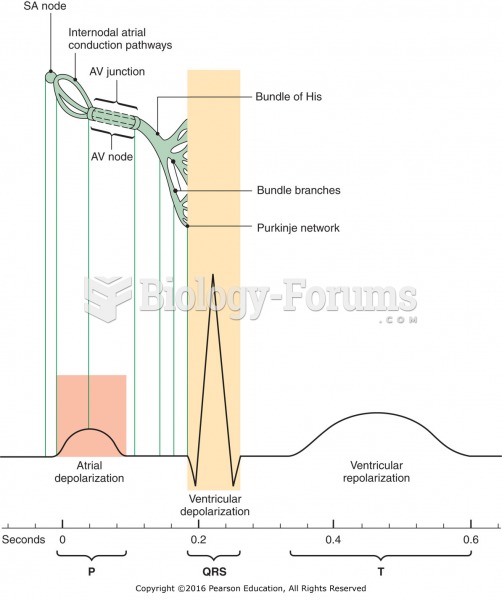 Relationship of the electrocardiogram to electrical conduction in the heart.
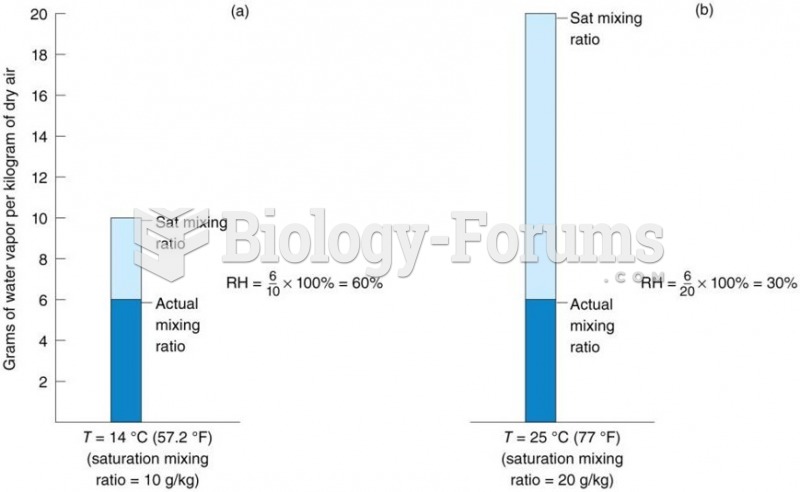 The relationship between RH and temperature.
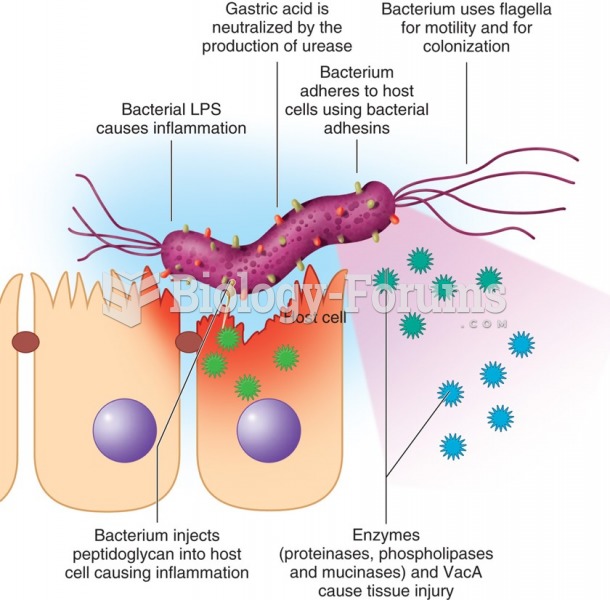 Schematic diagram of virulence factors of Helicobacter pylori.