|
|
|

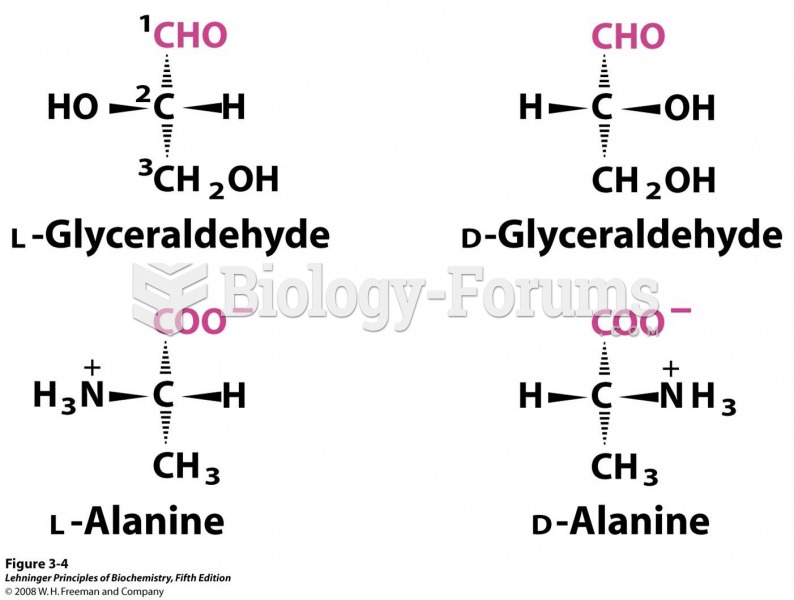 Steric relationship of the stereoisomers of alanine to the absolute configuration of L
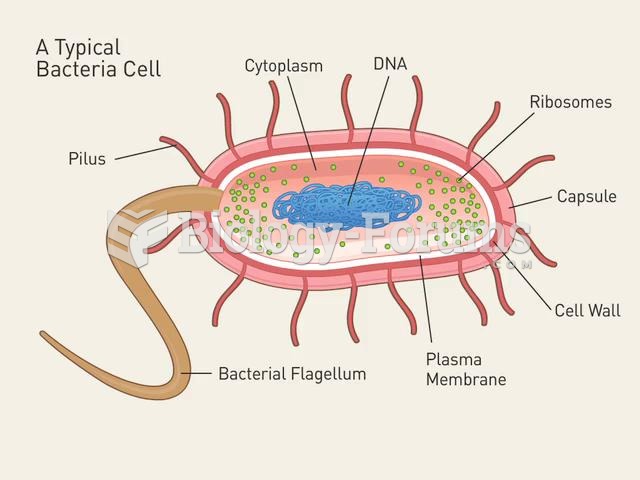 Bacteria Diagram
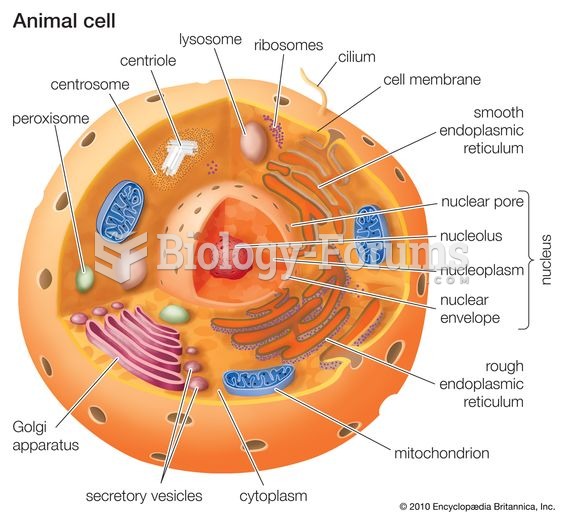 Diagram of a cell
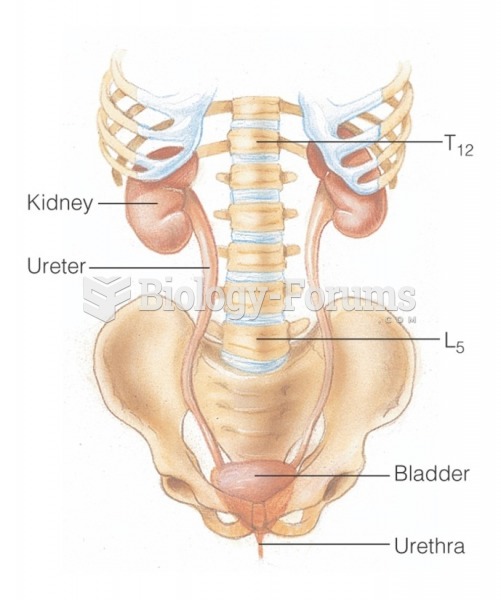 The urinary system: Relationship of the kidneys to the vertebrae
 Infant and Toddler Development and Responsive Program Planning: A Relationship-Based Approach
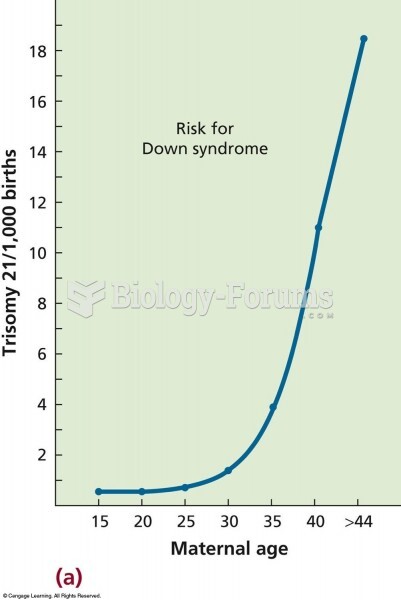 The relationship between maternal age and the frequency of trisomy 21 (Down syndrome). The risk incr