|
|
|

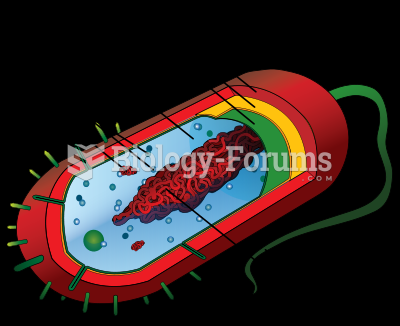 Diagram of a typical prokaryotic cell
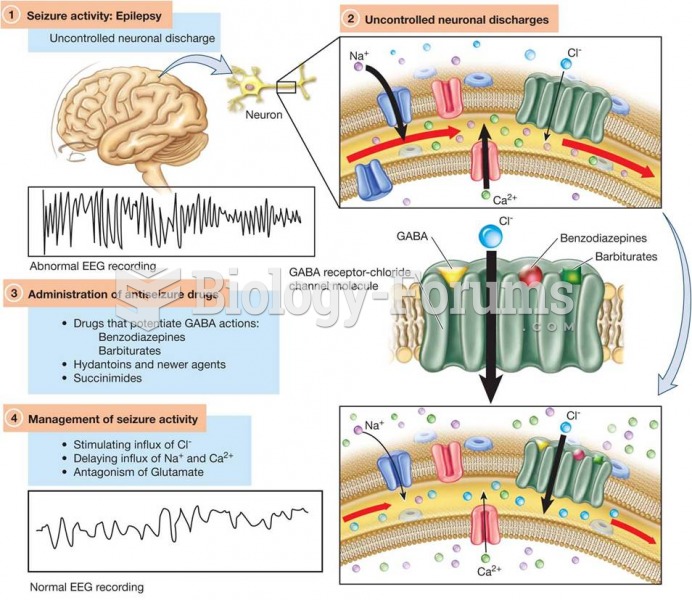 Model of the GABA Receptor–Chloride Channel Molecules in Relationship to Antiseizure Pharmacotherapy
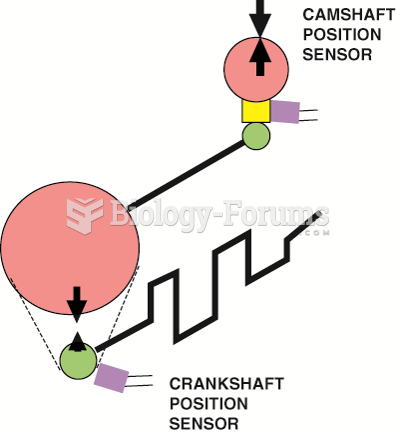 The relationship between the crankshaft position (CKP) sensor and the camshaft position (CMP) sensor ...
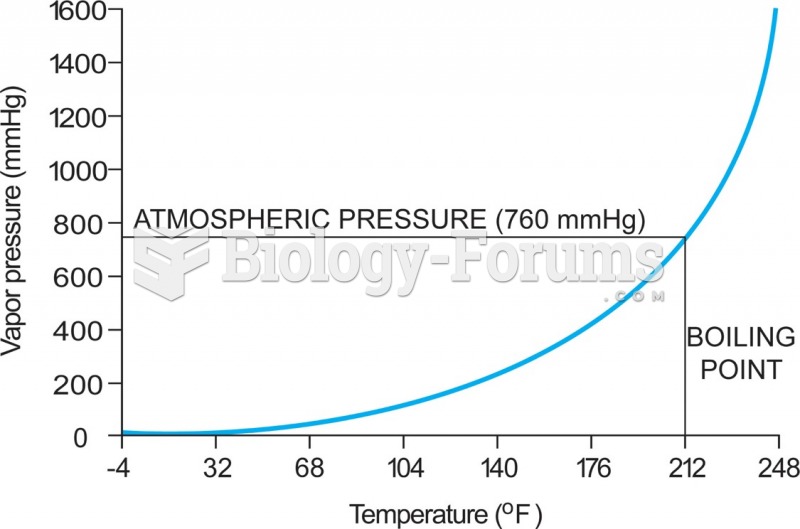 5-4 The relationship between vapor pressure and temperature—in this case for water. As the ...
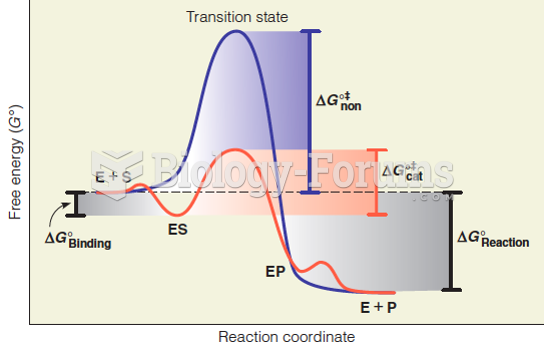 Reaction coordinate diagram for a simple enzyme catalyzed reaction
 Relationship between the number of amino acid substitutions