|
|
|

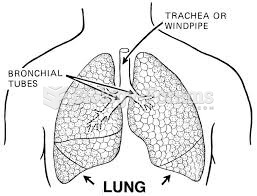 Human Lungs Diagram
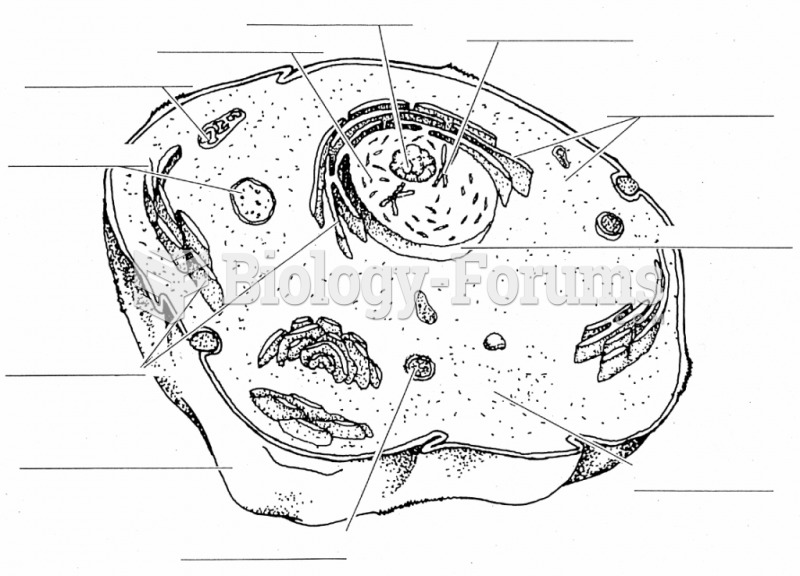 Blank cell diagram
 anatomy diagram
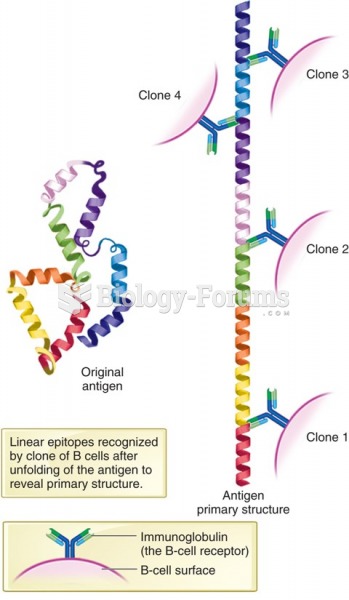 Schematic diagram showing polyclonal response by B cells against linear epitopes.
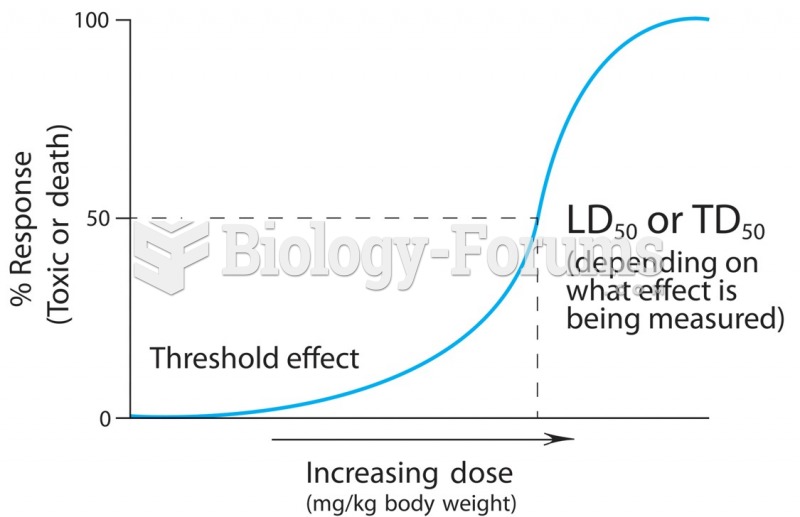 A dose-response curve describes the relationship between the quantity of the chemical entering the ...
 Relationship between birth weight and mortality in humans