|
|
|

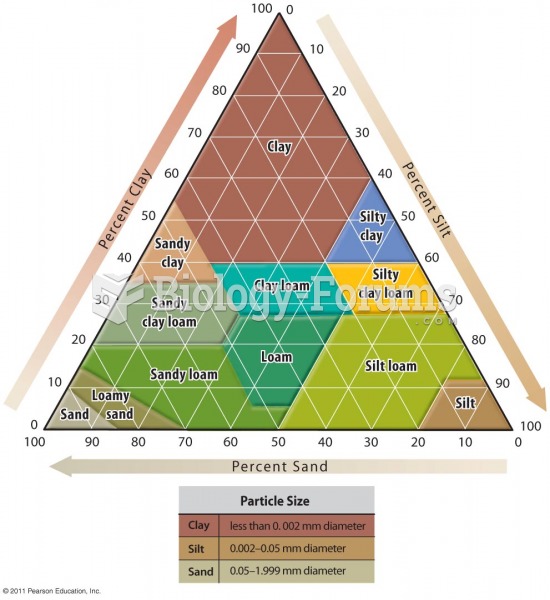 Soil Texture Diagram
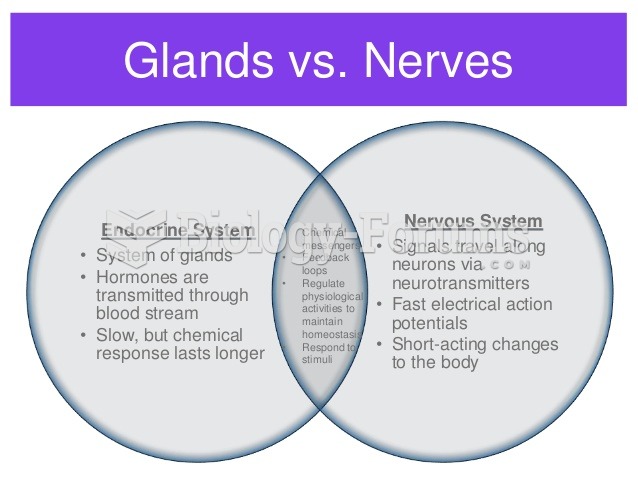 Venn Diagram of Nervous System and Endocrine System
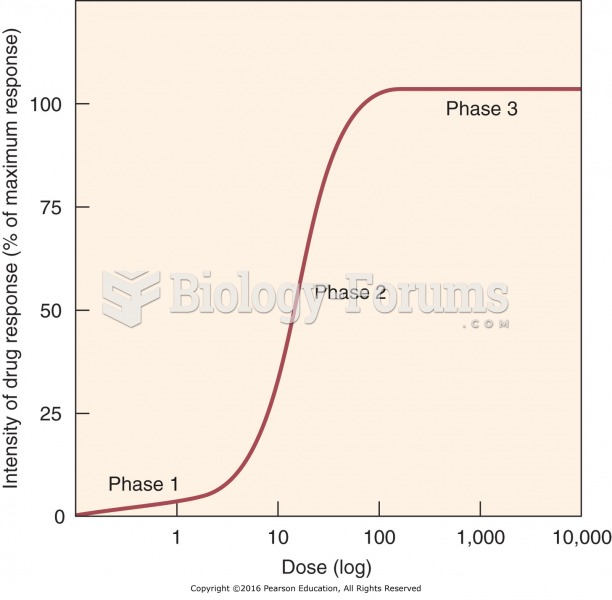 Dose–response relationship.
 A dose-response curve describes the relationship between the quantity of the chemical entering the ...
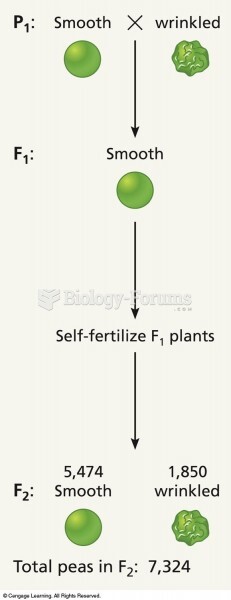 A diagram showing one of Mendel’s crosses. True-breeding strains of pea plants with smooth and ...
 Relationship between the number of amino acid substitutions