This topic contains a solution. Click here to go to the answer
|
|
|

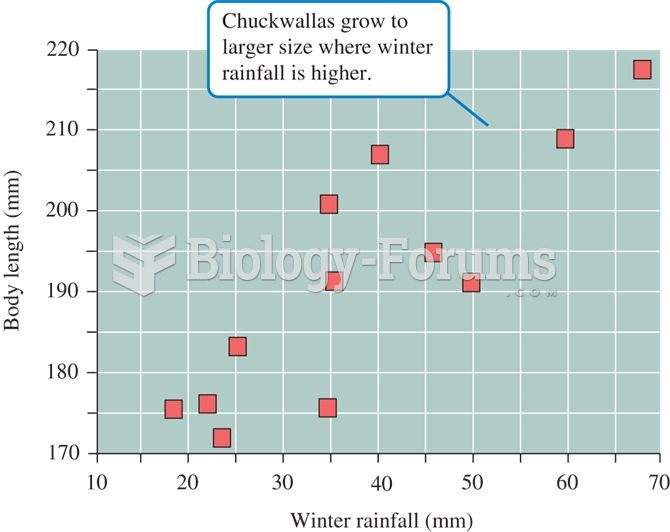 Relationship between winter rainfall and chuckwalla, Sauromalus, size
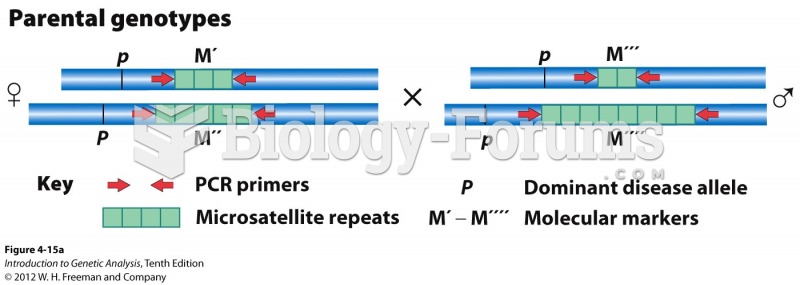 A microsatellite locus can show linkage to a disease gene
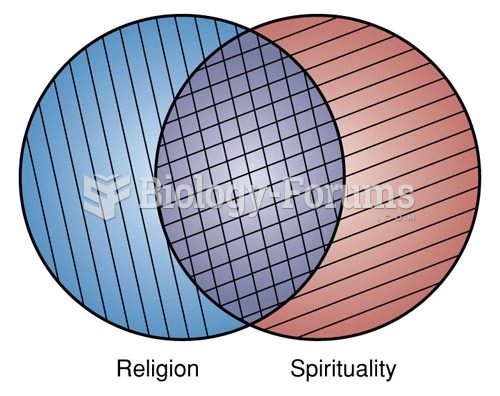 The Relationship Between Religion and Spirituality
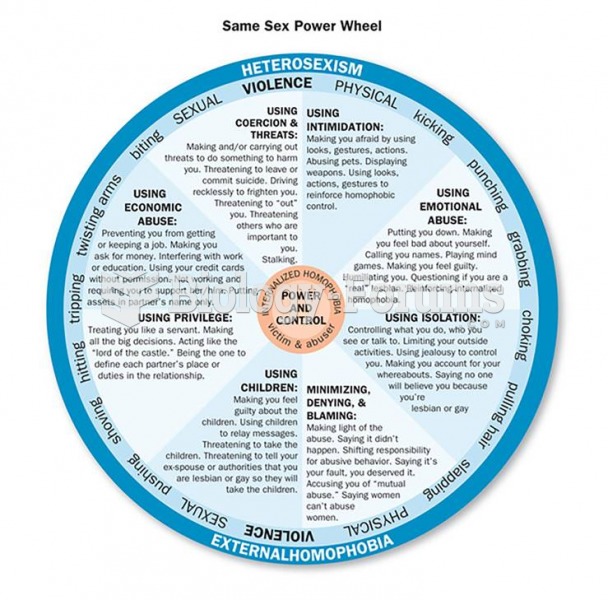 The Power and Control Wheels of Abusive Relationships When one person in a relationship repeatedly ...
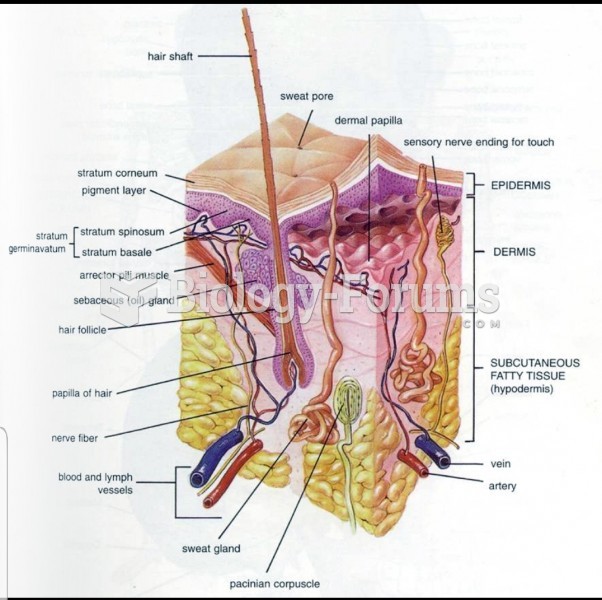 Skin layer diagram
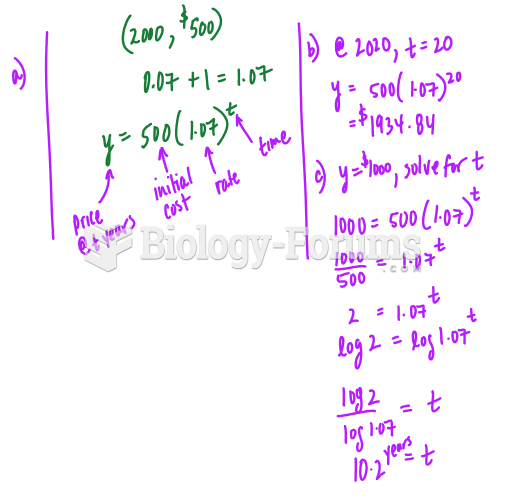 Answer the following short answer, please show your steps and include the formulas used