A graph that shows how the amount of advertising expenditure differs among various industries can be shown
A) by a trend-section graph.
B) by a scatter diagram.
C) by a time-series graph.
D) as a trend.
E) by a cross-section graph.
Question 2
The potential money multiplier gives us
A) the maximum potential change in the money supply due to a change in reserves.
B) the growth in real national income when the money supply increases.
C) the maximum potential change in the money supply due to a change in income.
D) the growth in the money supply when income increases.

 Localization of a Peptide The peptide is revealed by means of immunocytochemistry. The photomicrogra
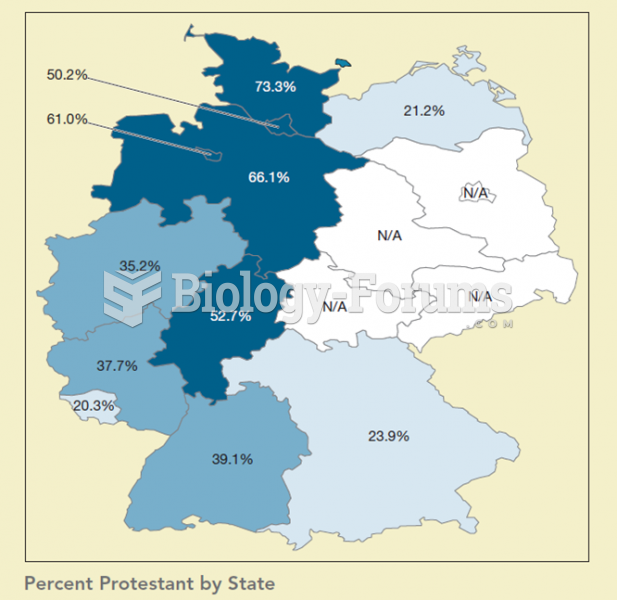 This map shows the percentage of Protestants by state in Germany. When compared to the previous map
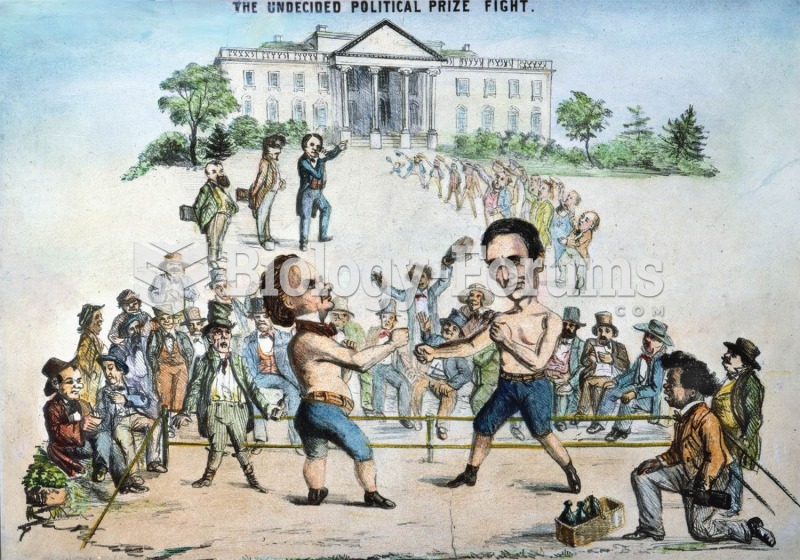 That politics was always a rough business is shown in this cartoon, which shows Lincoln, assisted by
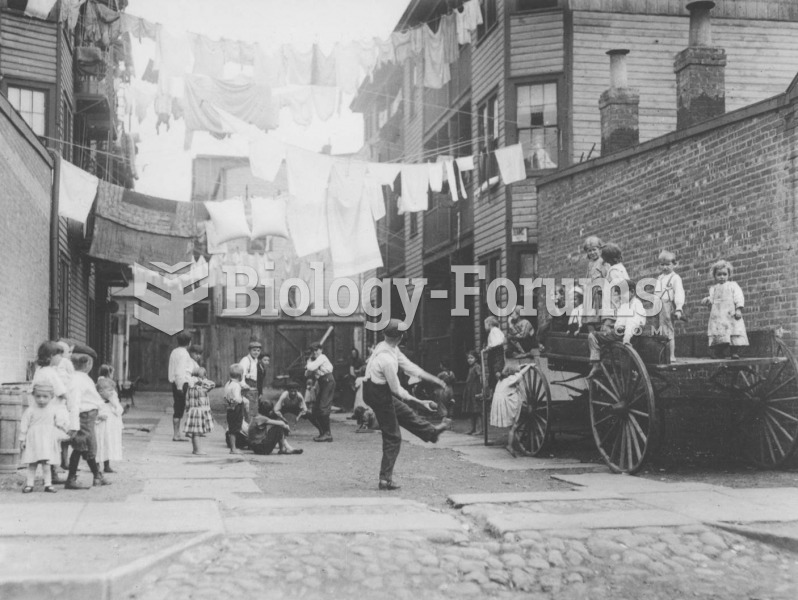 Lewis Hine’s 1910 photograph shows a tenement alley in New York City. More famous for his “unsettlin
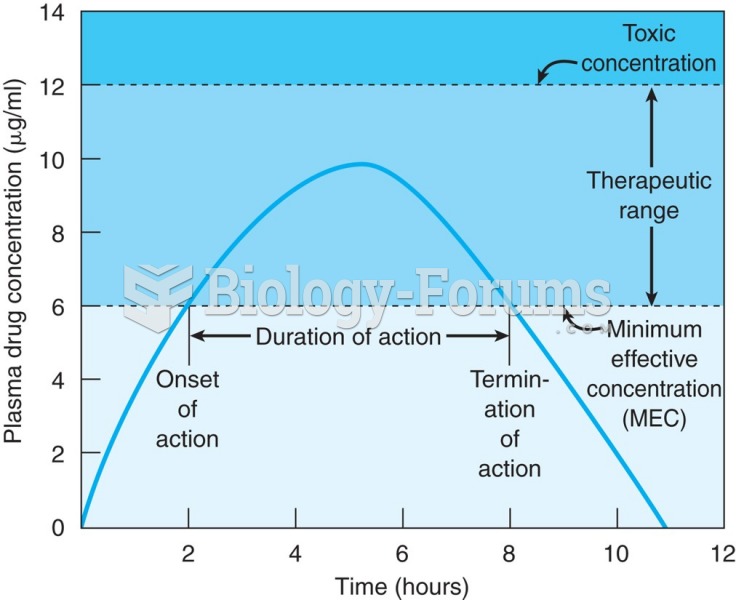 Graph showing oral administration of a single-dose drug. The time of onset is 2 hours and the end of ...
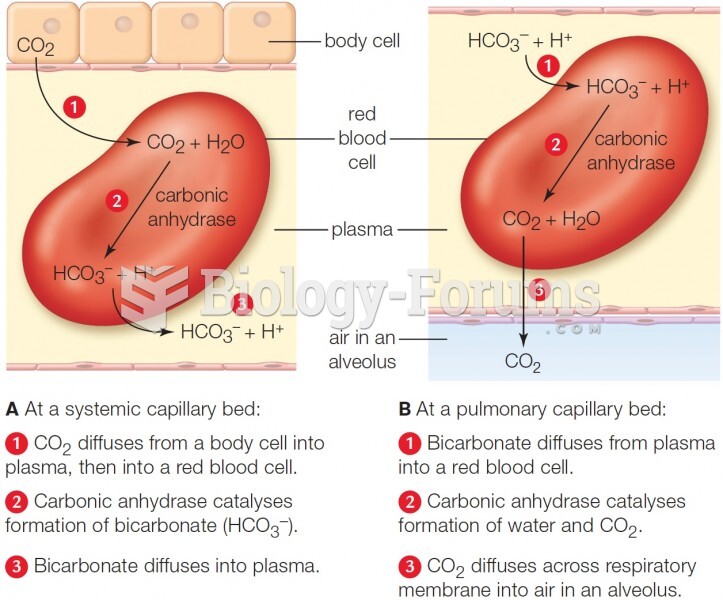 Main mechanism of carbon dioxide transport and exchange. A lesser amount of CO2 travels to the lungs