A graph that shows how the amount of advertising expenditure differs among various industries can be shown
A) by a trend-section graph.
B) by a scatter diagram.
C) by a time-series graph.
D) as a trend.
E) by a cross-section graph.
Question 2
The potential money multiplier gives us
A) the maximum potential change in the money supply due to a change in reserves.
B) the growth in real national income when the money supply increases.
C) the maximum potential change in the money supply due to a change in income.
D) the growth in the money supply when income increases.

 Log graph paper
 This January 1937 photo from Sneedville, Tennessee, shows Eunice Johns, age 9, and her husband, ...
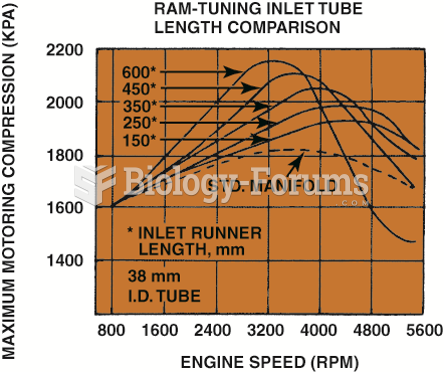 The graph shows the effect of sonic tuning of the intake manifold runners. The longer runners ...
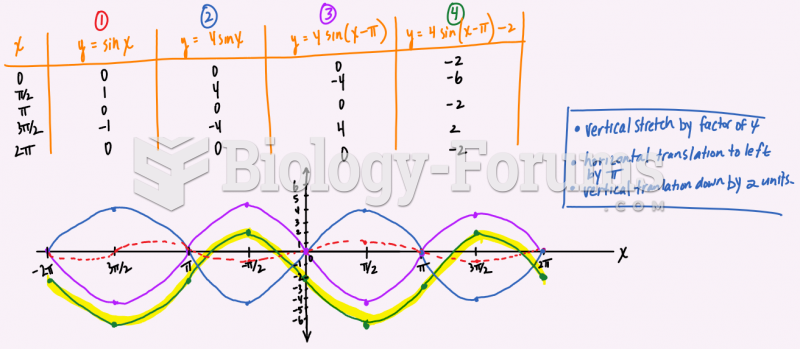 State the transformations on the function f(x)= 4sin(x-pi)-2 and then graph two cycles below.
 State the transformations on the function f(x)= 4sin(x-pi)-2 and then graph two cycles below.
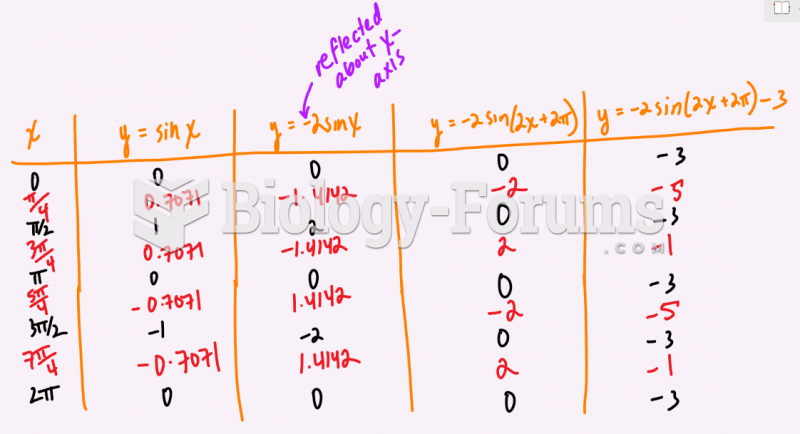
 To satisfy the inequality, sketch the following function by hand and shade the graph regions.