This topic contains a solution. Click here to go to the answer
|
|
|

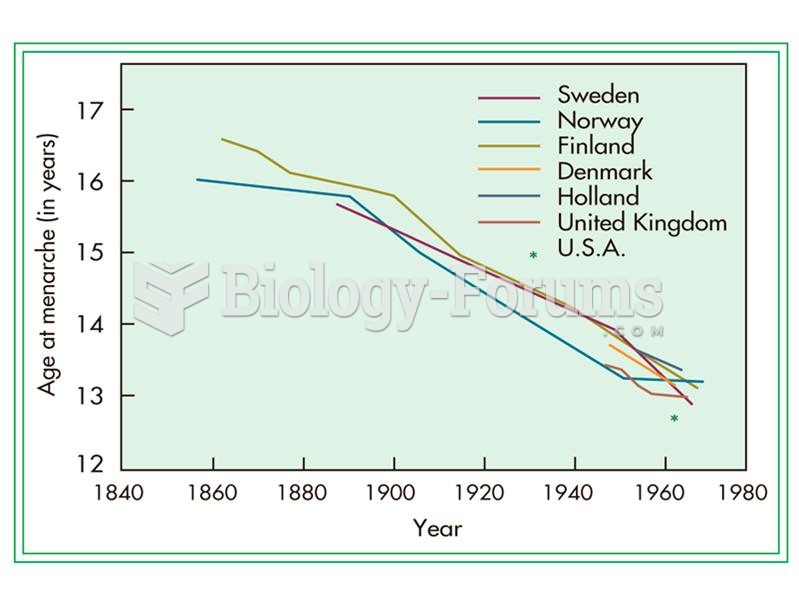 The declining age of menarche over the past 150 years has been measured in many European countries,
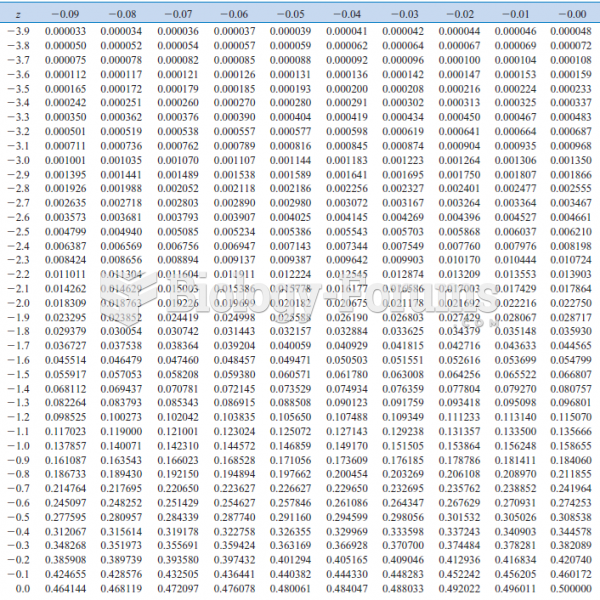 Cumulative Standard Normal Distribution
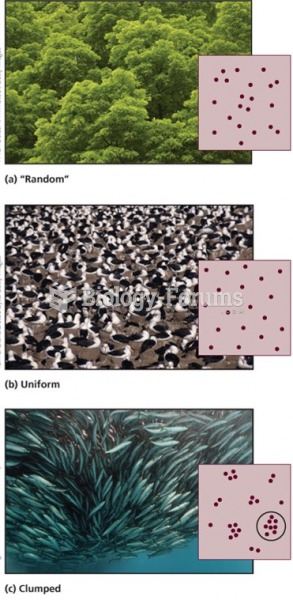 Population distribution (dispersion)
 Evaluate then graph the following limits
 The threshold model explains the discontinuous distribution of some multifactorial traits. In this m
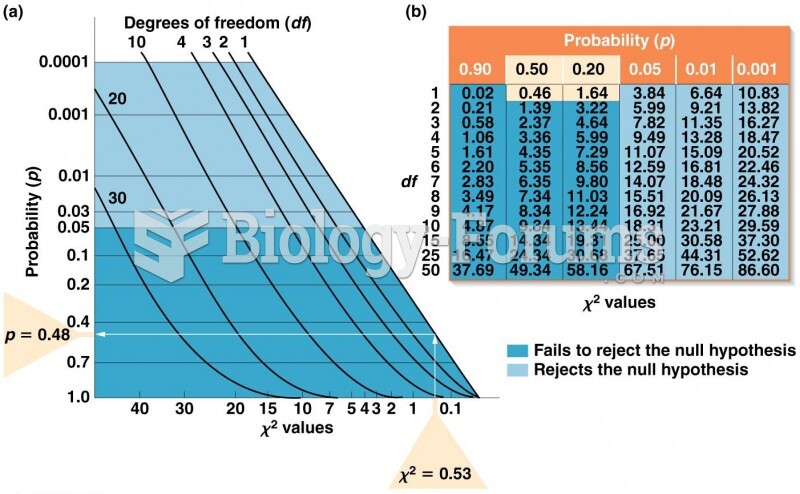 (a) Graph for converting values to p values. (b) Table of values for selected values of df