|
|
|

 Hubble Telescope in 2009
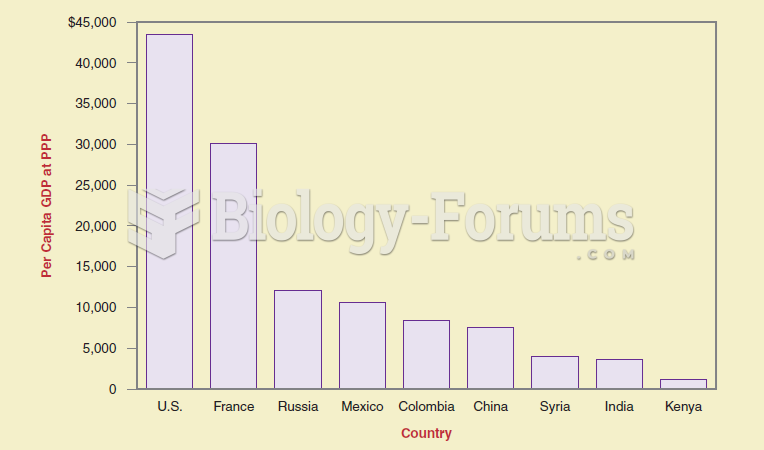 If you want to show differences between items at the same time, a bar graph is more effective than a
 Stressing that education reproduces a country’s social class system, conflict theorists point out ...
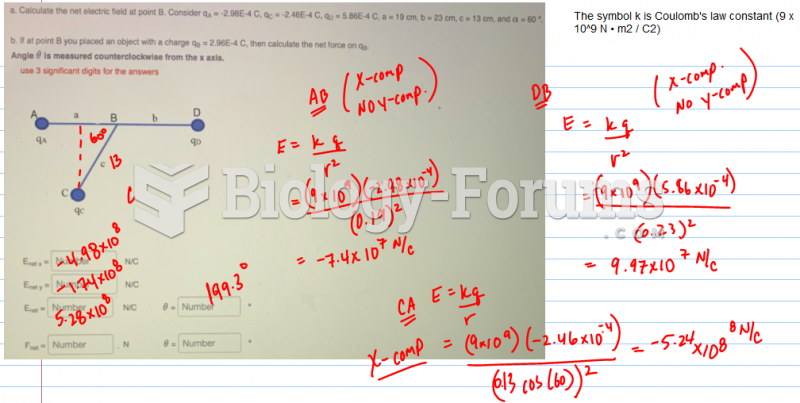 . Calculate the net electric field at point B
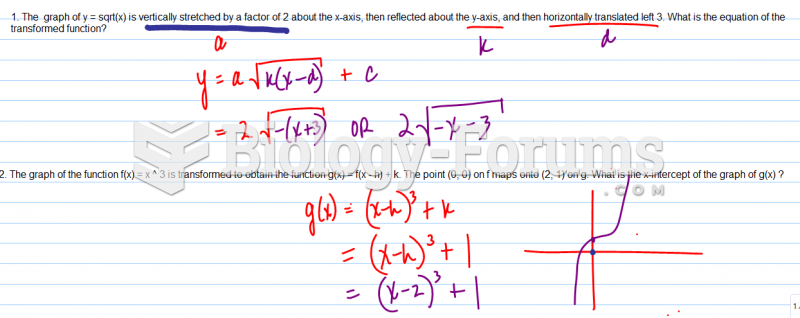 The graph of y = sqrt(x) is vertically stretched by a factor
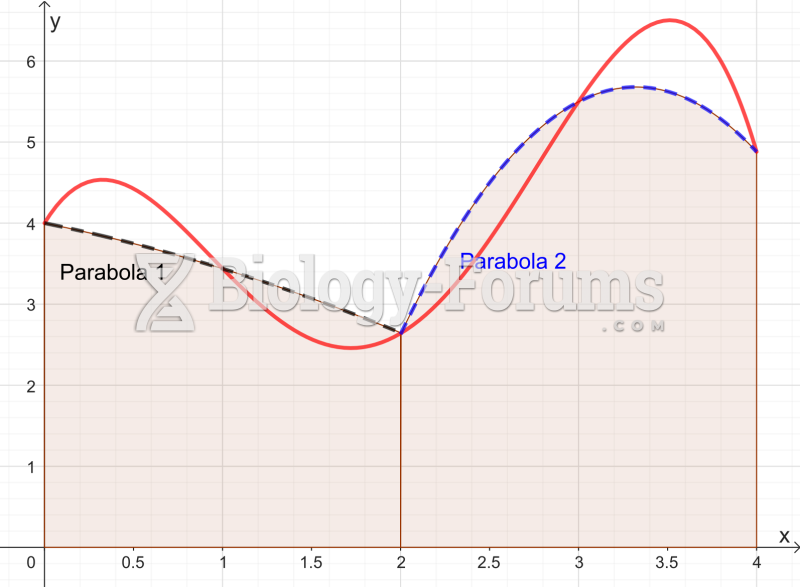 Graph approximated by two parabolas for the Simpson's rule