|
|
|

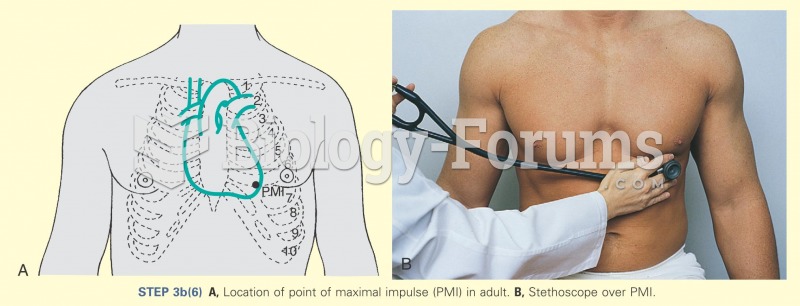 Location of point of maximum effort
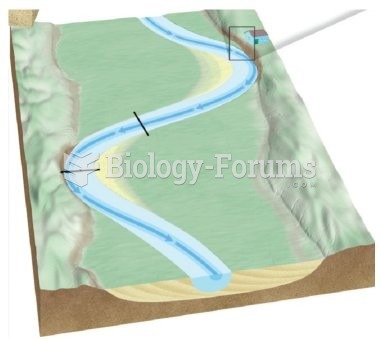 Label the cutbank and point bar on this image.
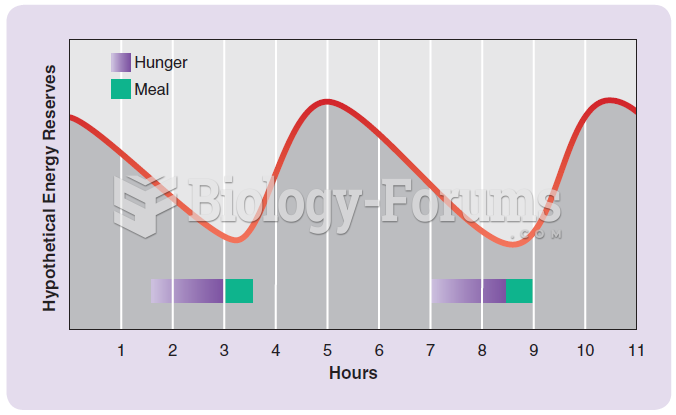 The energy set-point view that is the basis of many people’s thinking about hunger and eating.
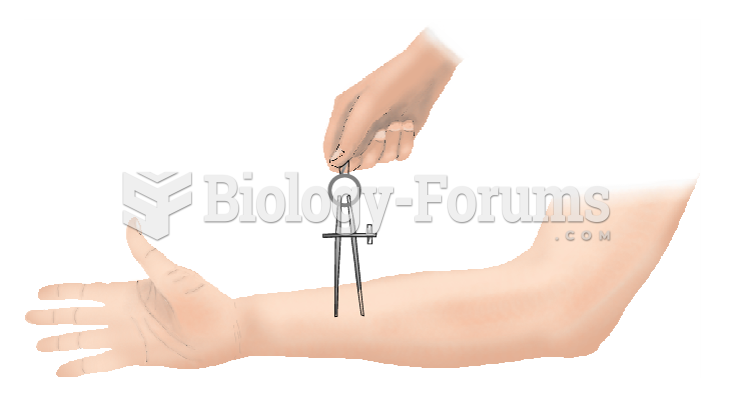 The Method for Determining the Two-Point Discrimination Threshold
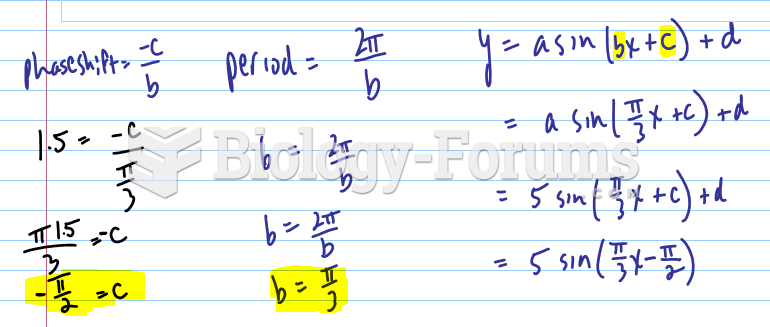 Sketch a graph of the function h(x), by hand on the following interval:
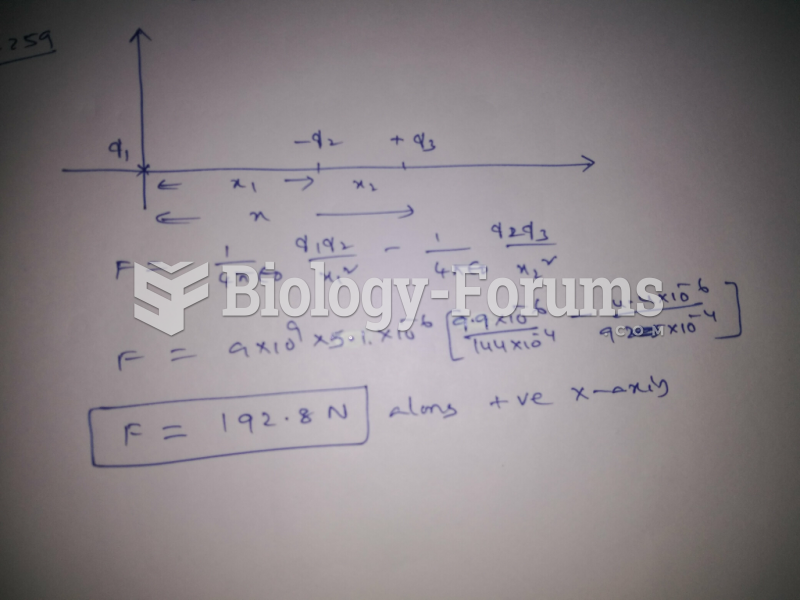 Three point charges lie on the x x axis. Charge 1 (+9.9 μC μ C ) is at the origin, ...