|
|
|

 Map depicting the 2010 West Nile virus infections.
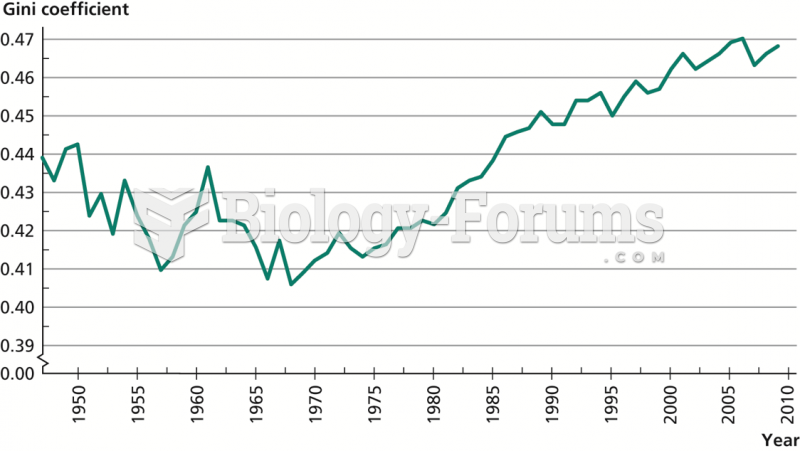 Income Inequality in the United States: 1947–2009
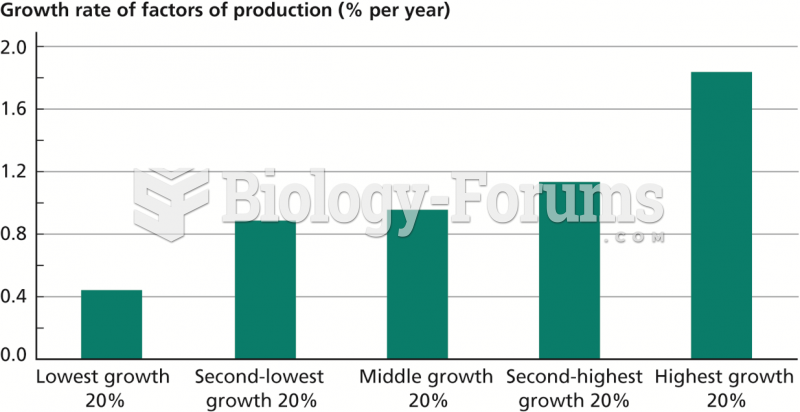 Role of Factors of Production in Determining Growth, 1975–2009
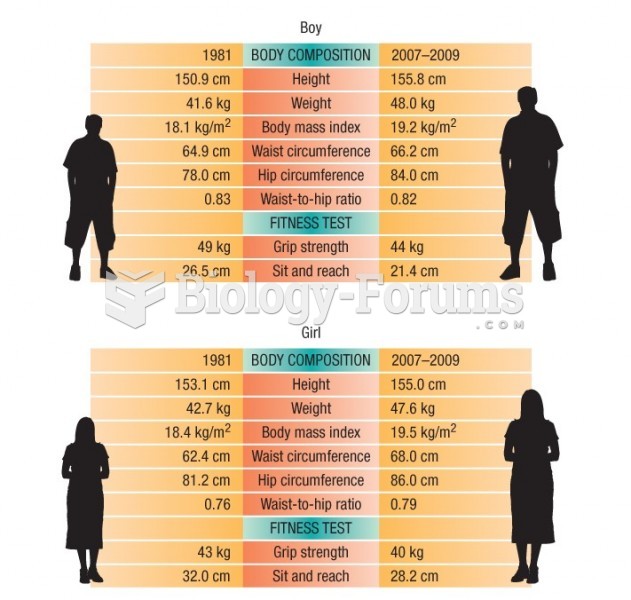 Portrait of Typical 12-year-old Boy and Girl, 1981 and 2007-2009
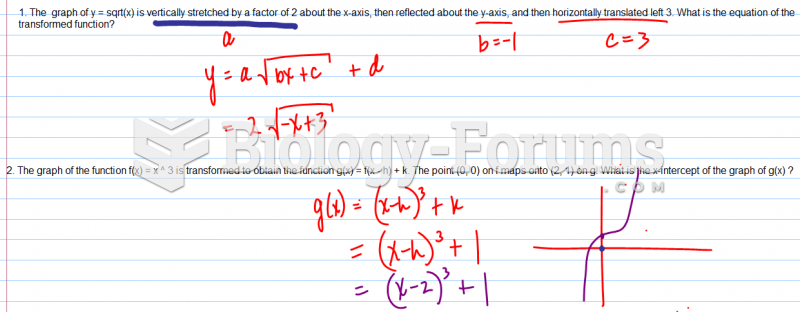 The graph of y = sqrt(x) is vertically stretched by a factor
 Emerson’s Three-Point Test-Cross Analysis