|
|
|

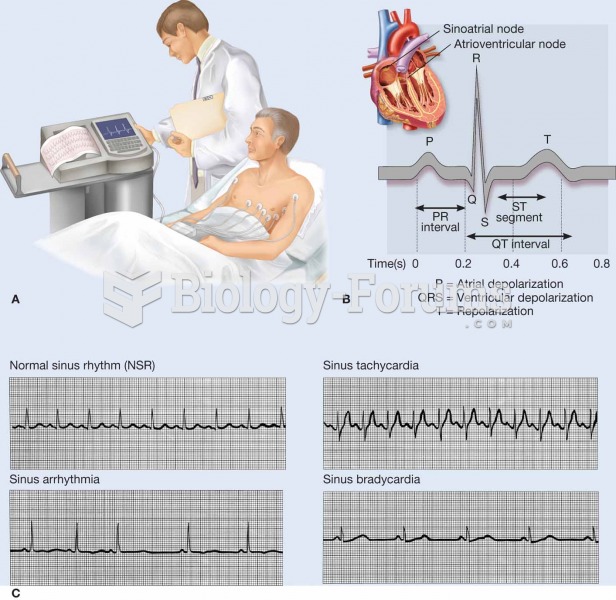 An electrocardiogram (ECG, EKG) is a commonly used procedure in which the electrical events associat
 The Ford logo on display at the 2009 New York International Auto Show.
 Map depicting the 2010 West Nile virus infections.
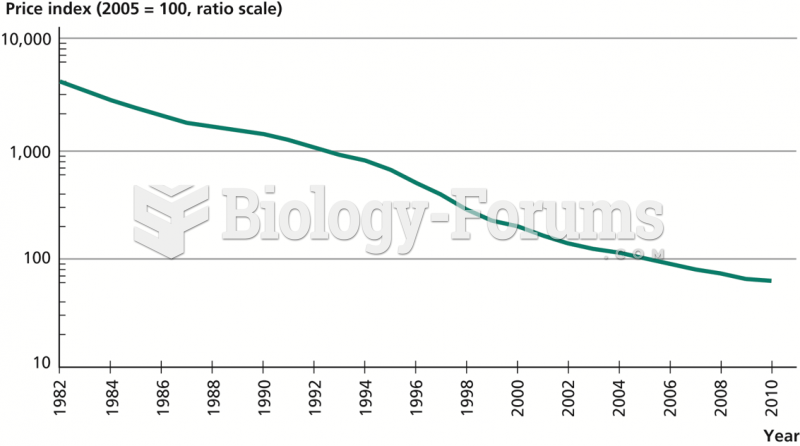 Price of Computers, 1982–2010
 Two-point discrimination
 Constructing a Three-Point Recombination Map