|
|
|

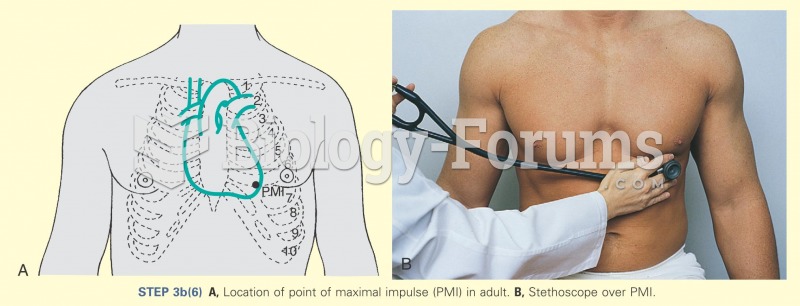 Location of point of maximum effort
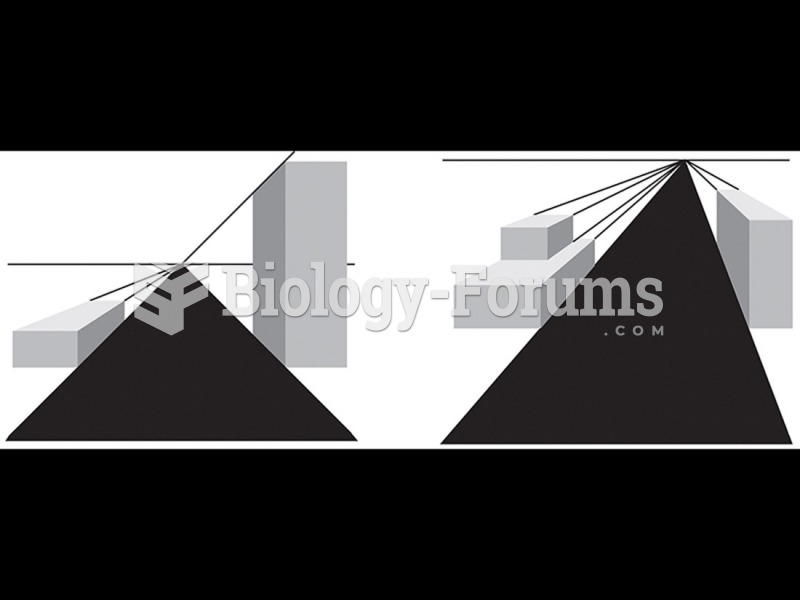 One-point linear perspective.
 Positive velocity graph
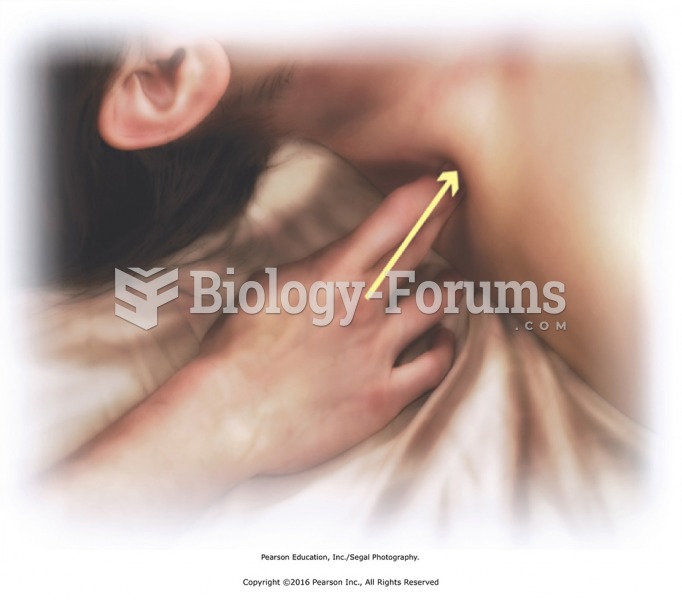 Finger pressure to a trigger point.
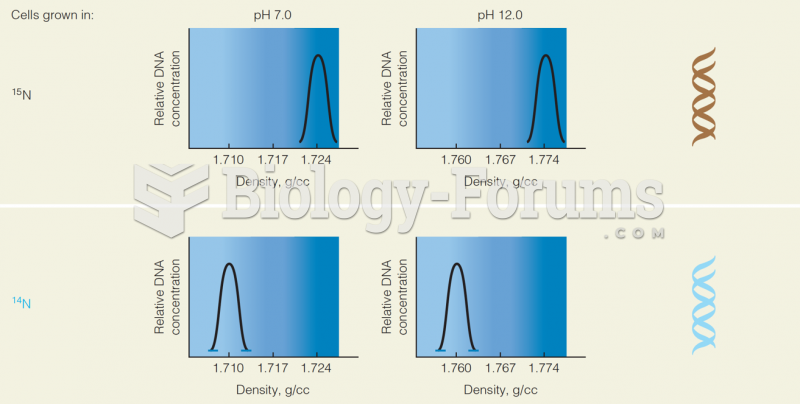 Cell Grown in 15N and 14 N: Graph of Relative DNA Concentration Vs. the Density
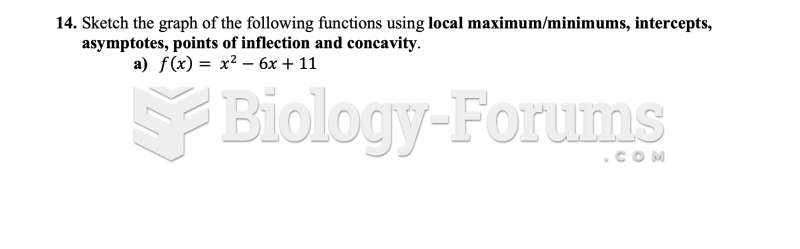 calculus homework graph help please