|
|
|

 A nurse shows empathy to a client.
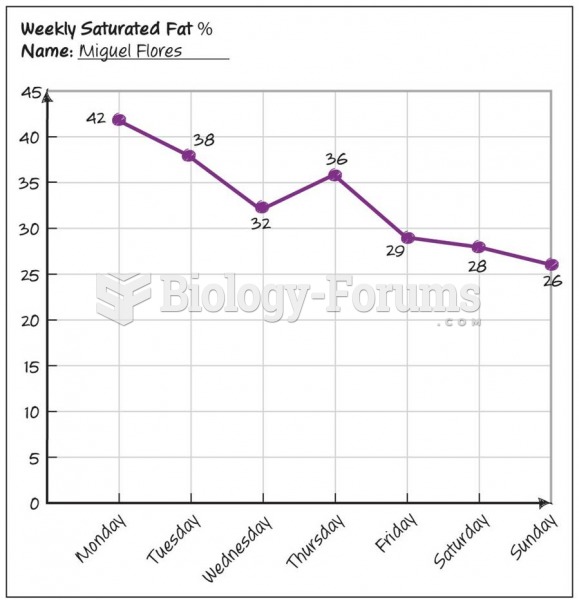 Progression Graph
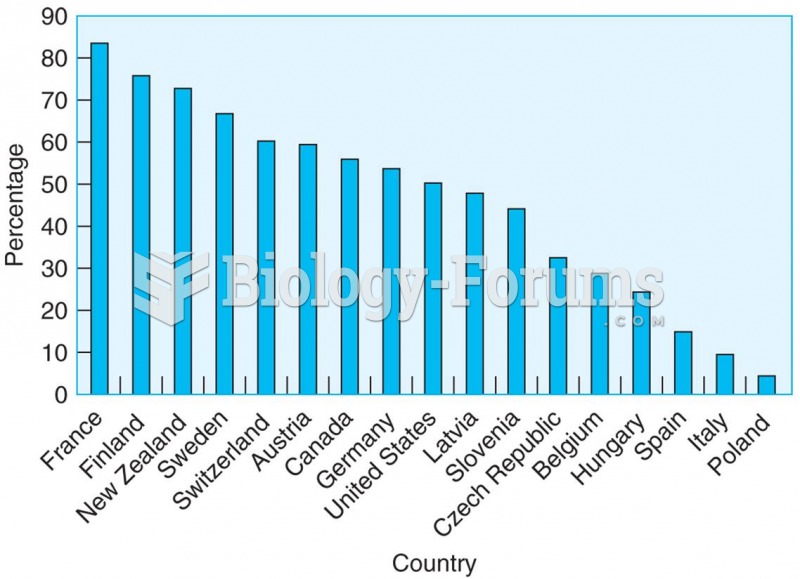 The percentage of women who have cohabited by the age of 45 for 17 countries shows that the ...
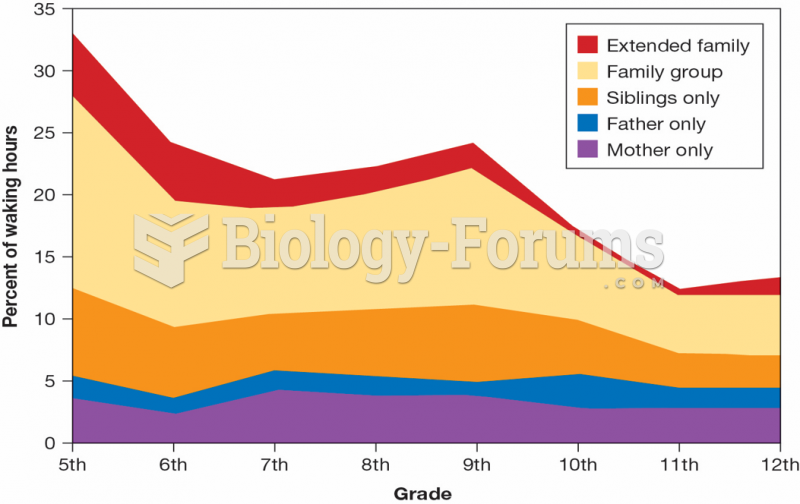 Changes in Time Spent with Family Members
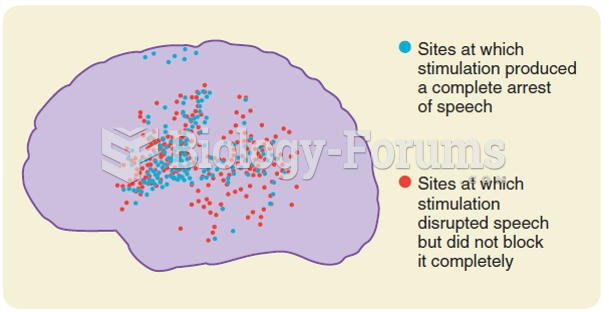 The wide distribution of left hemisphere sites where cortical stimulation either blocked speech or ...
 Detection of 3020insC in CARD15 in a family with Crohn’s disease