|
|
|

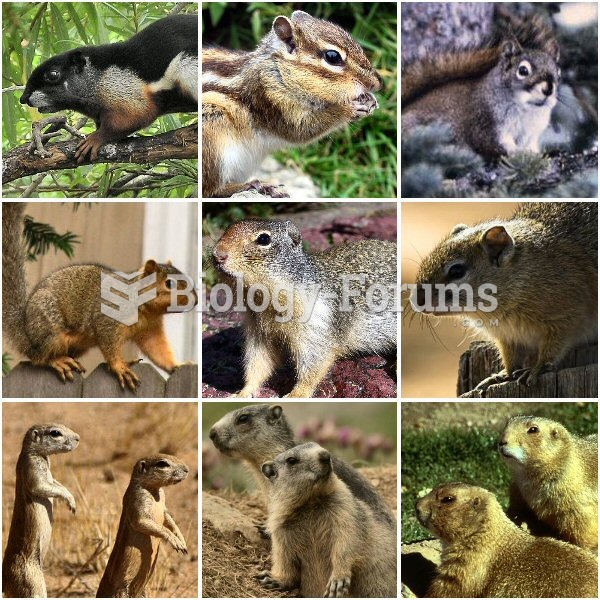 Various members of the Sciuridae family
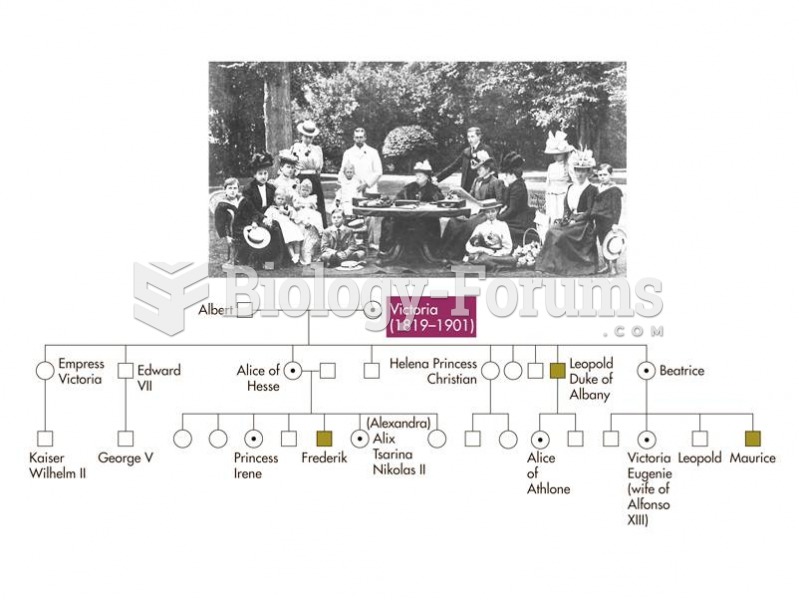 Queen Victoria and her family, and a pedigree showing the transmission of hemophilia in the British
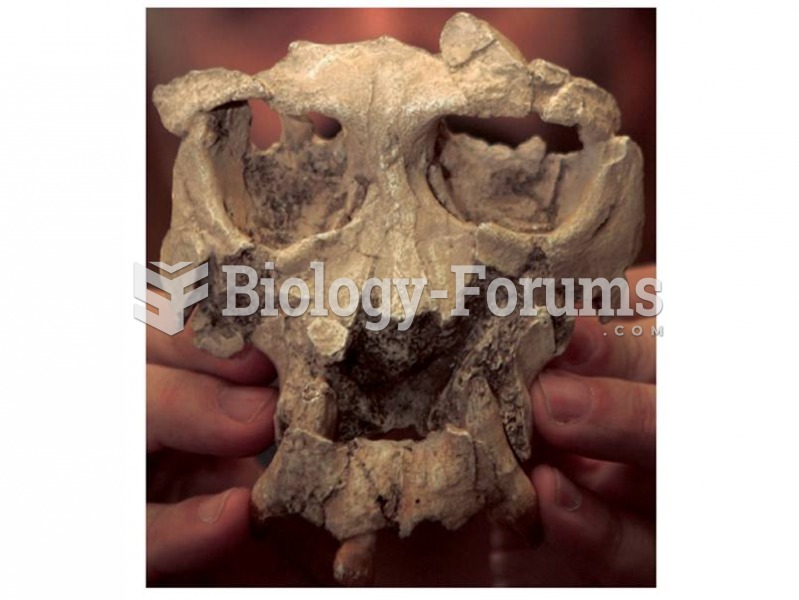 Pierolapithecus catalunicus may be an ancestor of great apes and humans. Its postcranial skeleton sh
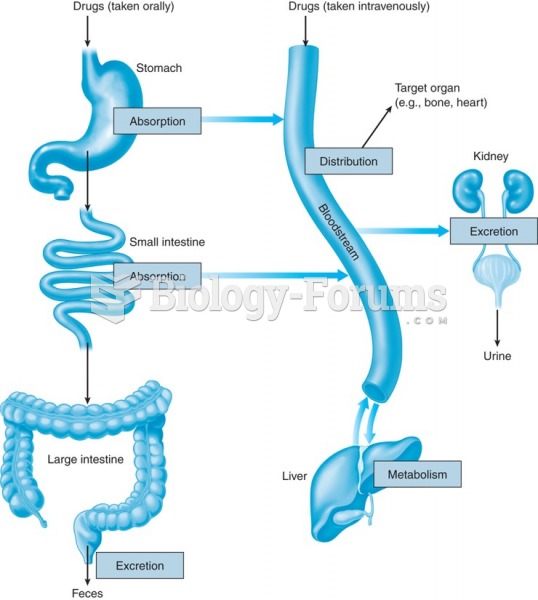 Movement of a drug through the body (pharmacokinetics): absorption, distribution, metabolism, and ...
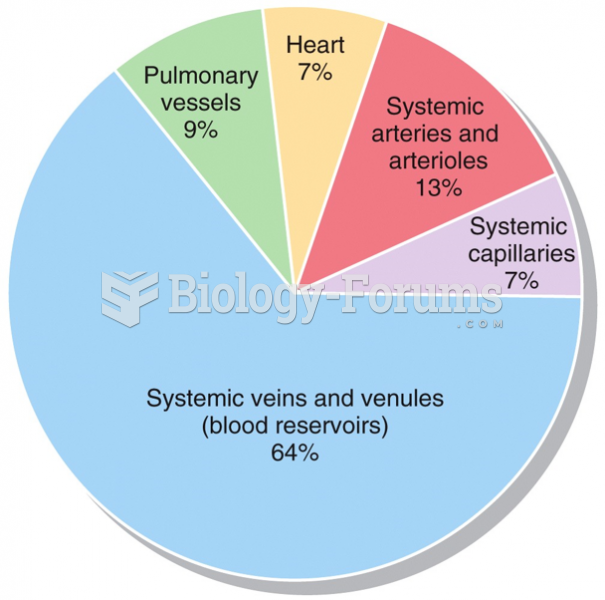 Blood Distribution
 My family