|
|
|

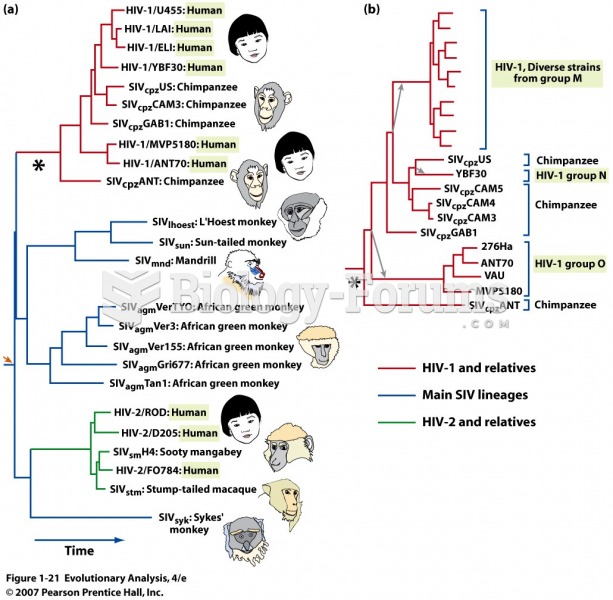 The family tree of HIV and related viruses
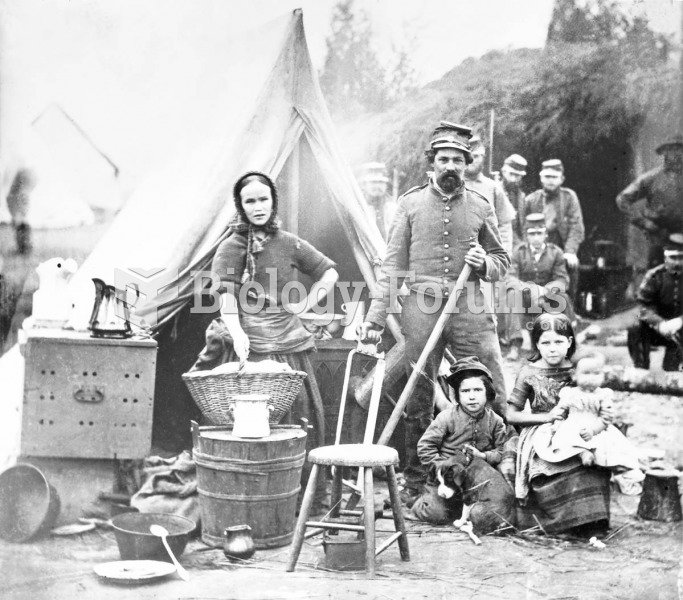 The family of a soldier in the 31st Philadelphia Infantry camps near Washington, DC. Although both a
 Resemblances in psychological traits among family members can be used to tease apart the ...
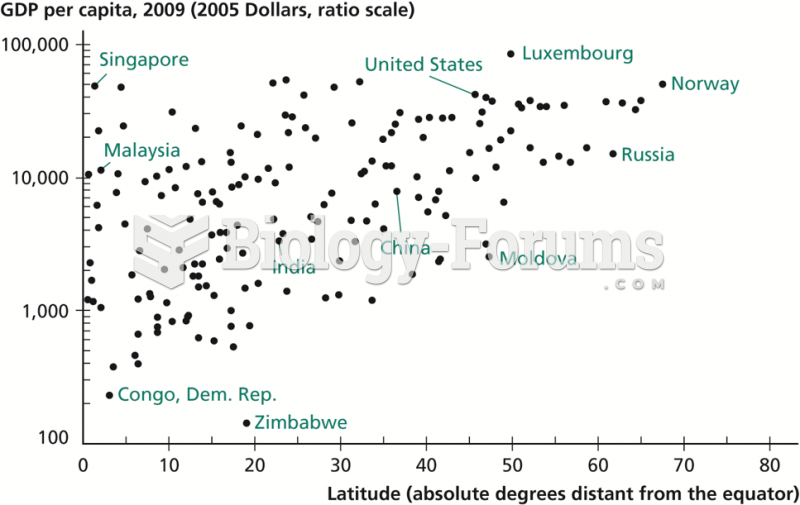 Relationship between Latitude and Income per Capita
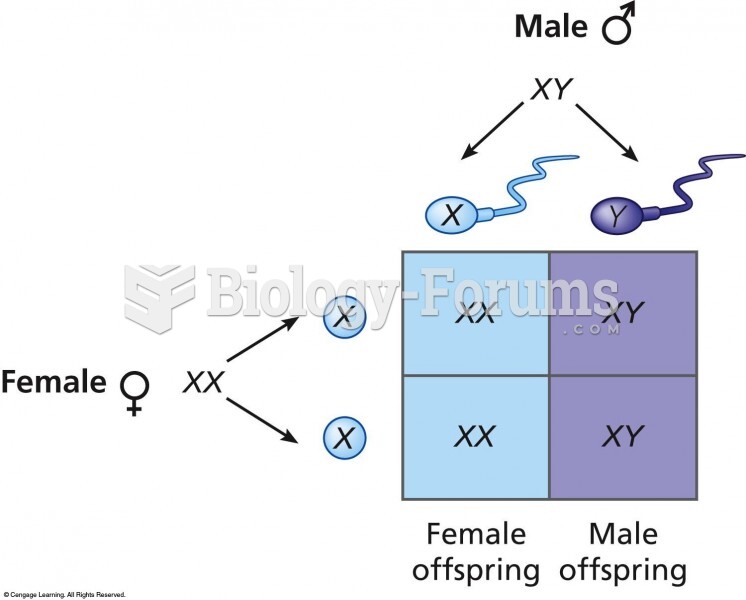 Distribution of sex chromosomes from generation to generation. All children receive an X chromosome
 The distribution of Neandertal and Denisovan DNA in the modern human genome