|
|
|

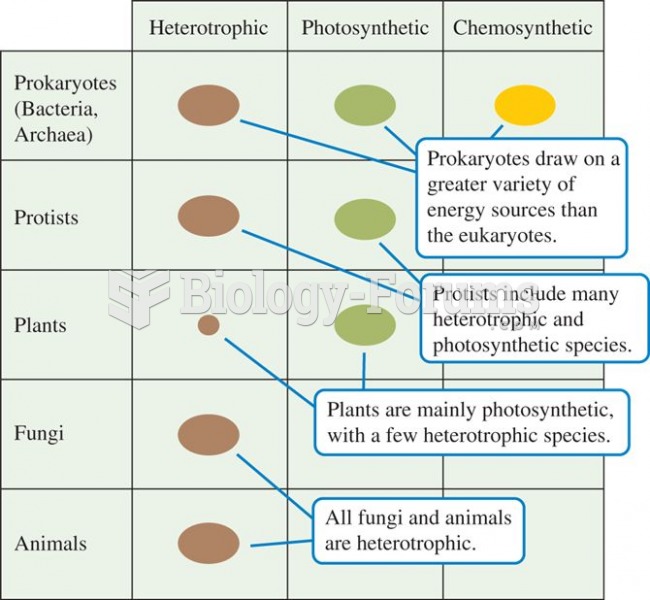 A plot of trophic diversity across the major groups of organisms shows highest trophic diversity amo
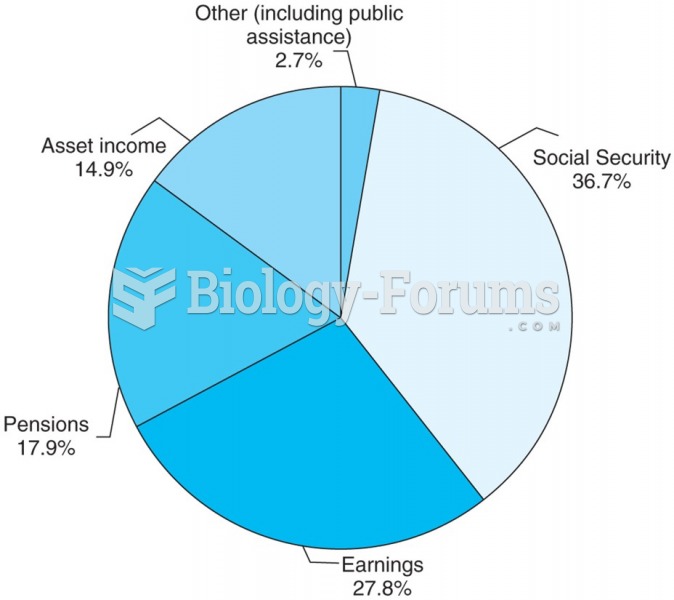 Sources of income for U.S. population aged 65 and over.
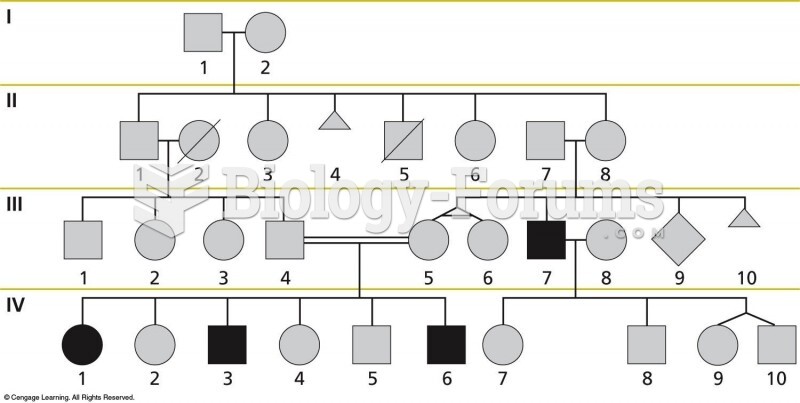 A pedigree showing the inheritance of a trait through several generations of a family.
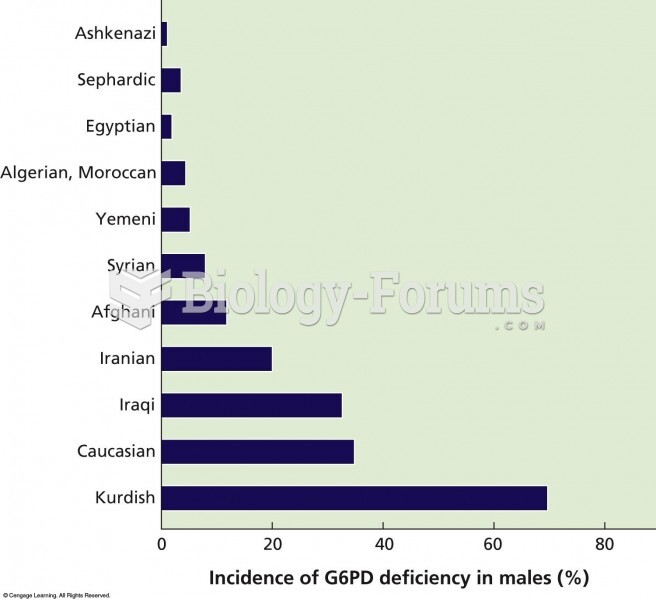 Distribution of glucose-6-phosphate dehydrogenase (G6PD) deficiency in various Jewish populations. B
 Meiosis is used to make sperm and egg cells. A shows a simplified version and B shows a detailed ver