|
|
|

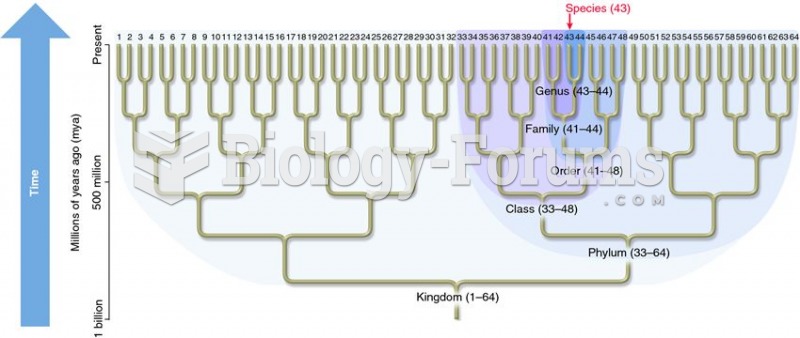 Schematic relationship between a phylogenetic tree and taxonomy.
 Establishing a caring and trusting relationship helps the client come to terms with a terminal illne
 Latest Post Display
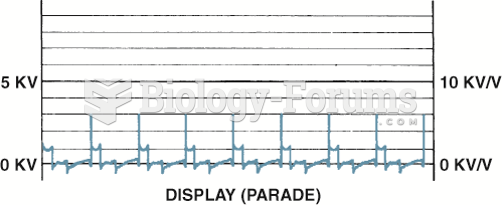 Display is the only position to view the firing lines of all cylinders. Cylinder 1 is displayed on ...
 The relationship between the height of the firing line and length of the spark line can be ...
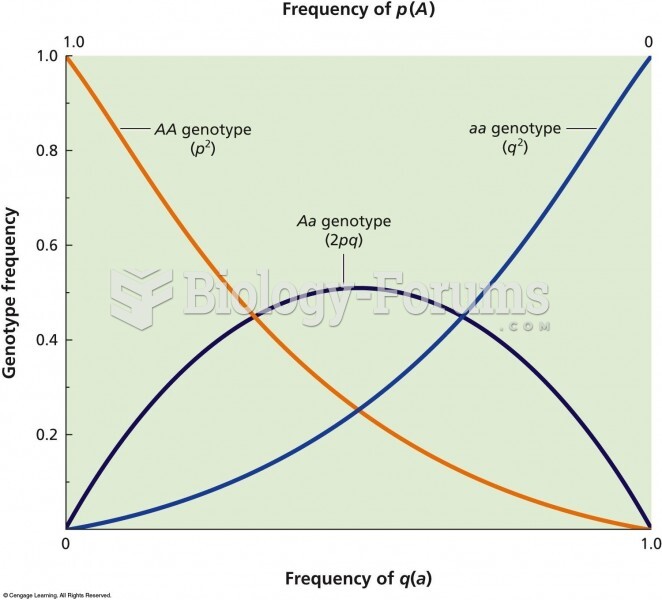 The relationship between allelic frequency and genotypic frequency in a population that is in Hardy-