|
|
|

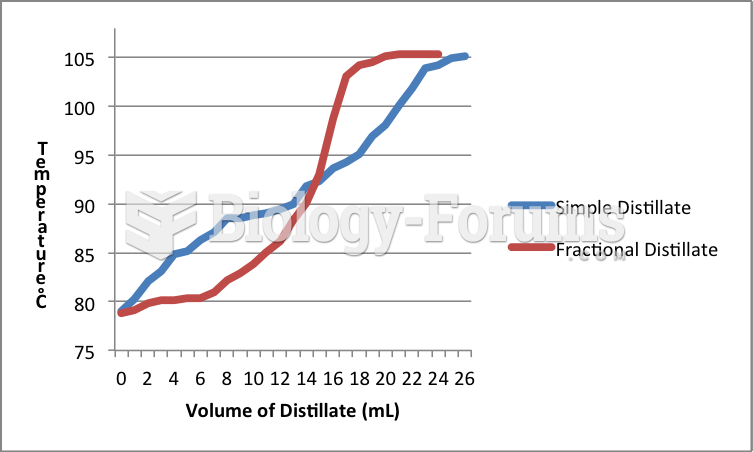 Distillation Graph Comparision
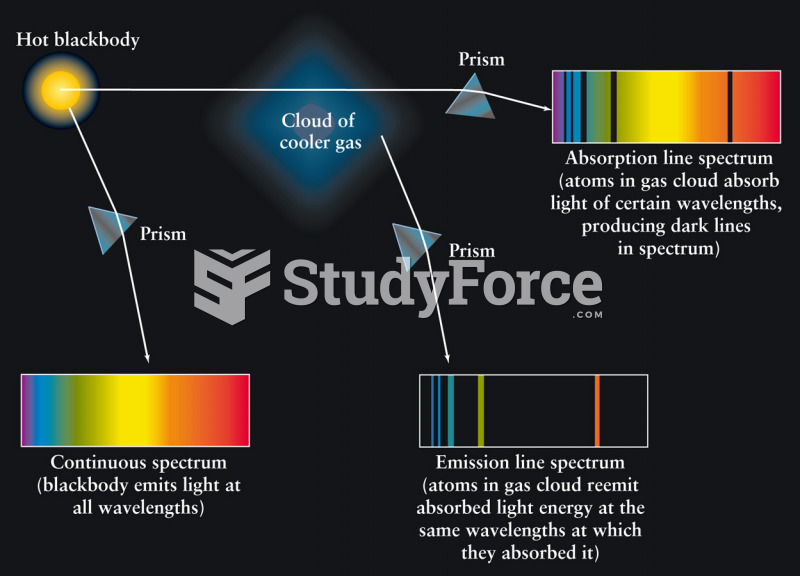 Continuous, Absorption Line, and Emission Line Spectra
 Funerary mask (Mask of Agamemnon), from Grave Circle A, Mycenae, Greece.
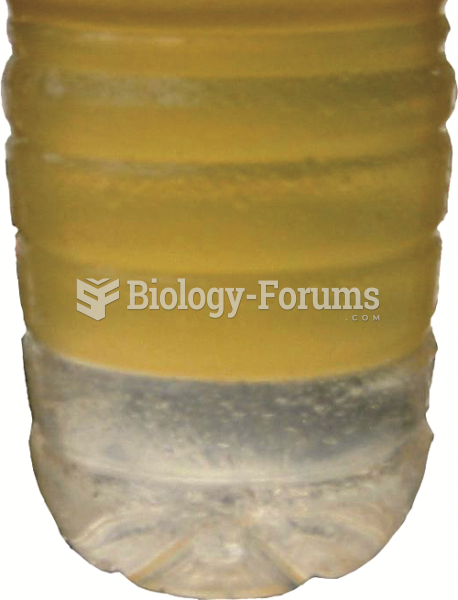 A container with gasoline containing alcohol. Notice the separation line where the alcohol-water ...
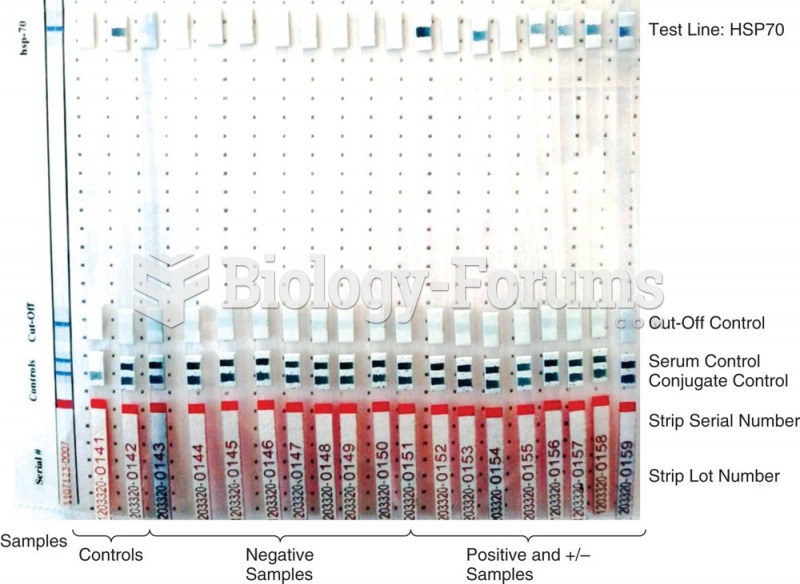 Line immunoassay (LIA), also recombinant immunoblot assay (RIBA) and Immuno-stripe, is similar to a ...
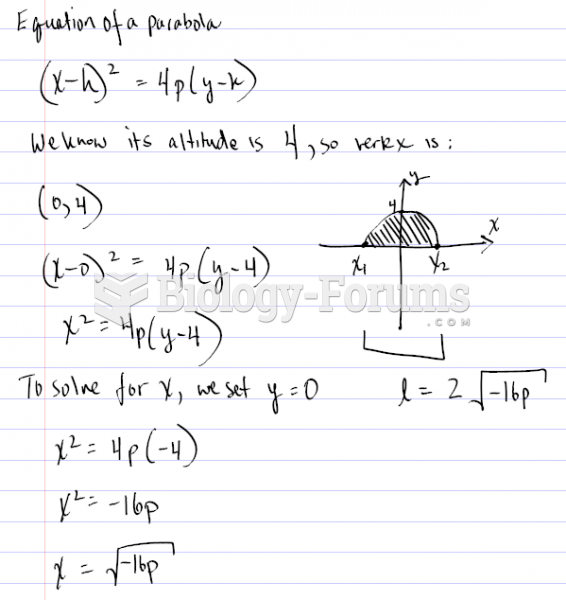 Finding the graph of a Parabola using certain values