|
|
|

 This image shows an artists depiction of a 10-kilometer (six-mile) diameter astero
 Children’s interactions with older siblings may help promote an understanding of other people’s ...
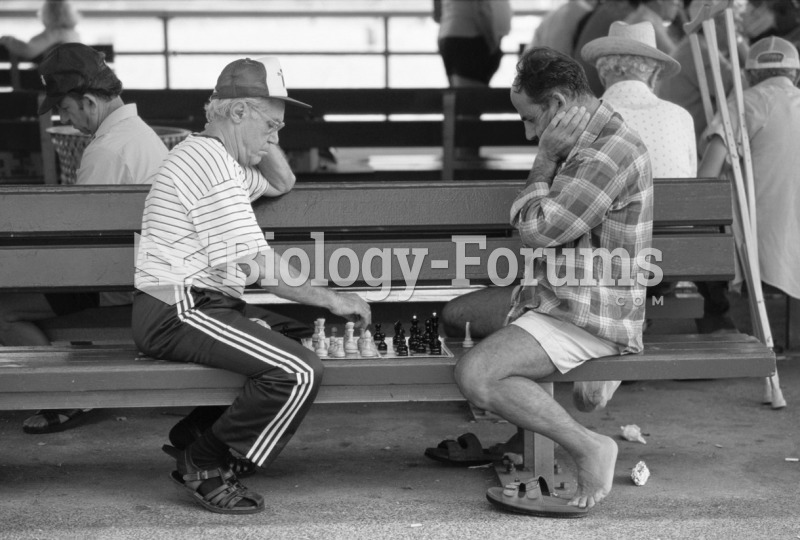 Older people who exercise cognitive skills, like these chess players, retain those skills well into ...
 Where do you think these people fit in Gans’ classification of urban dwellers?
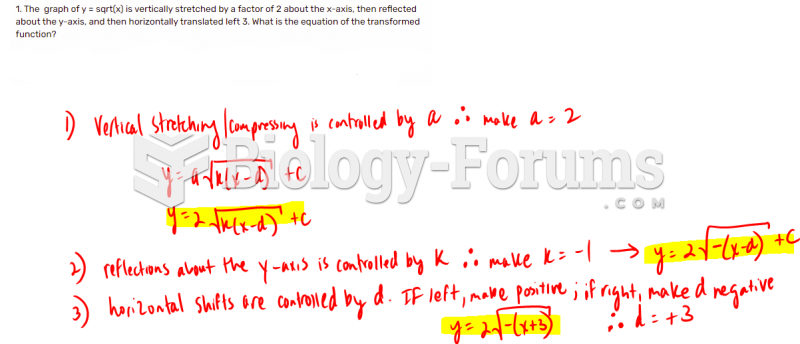 The graph of y = sqrt(x) is vertically stretched by a factor
 A melting profile shows the increase in UV absorption versus temperature