|
|
|

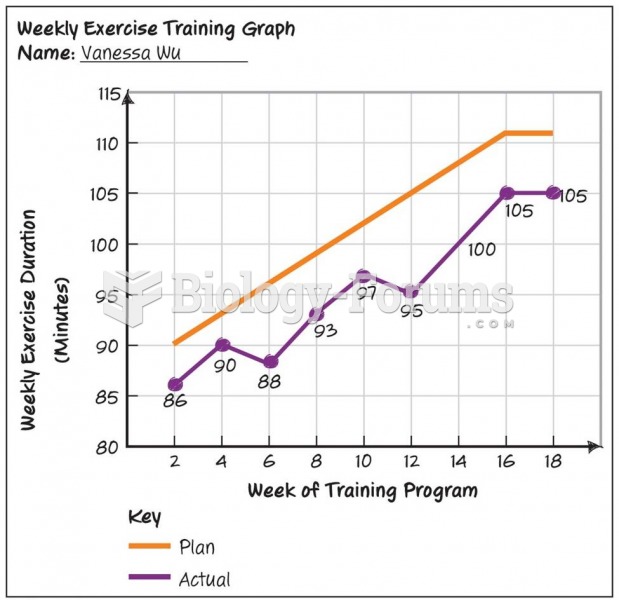 Progression Graph: Fitness Plan
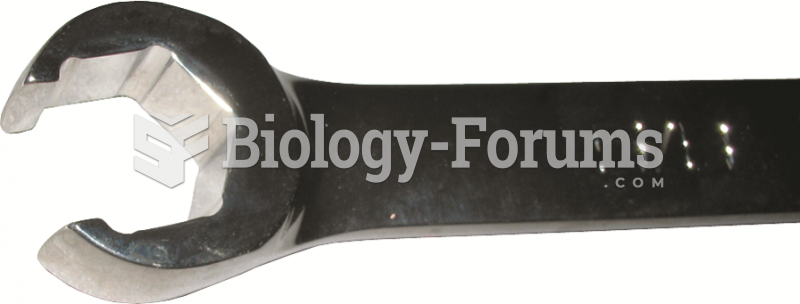 The end of a typical line wrench, which shows that it is capable of grasping most of the head of ...
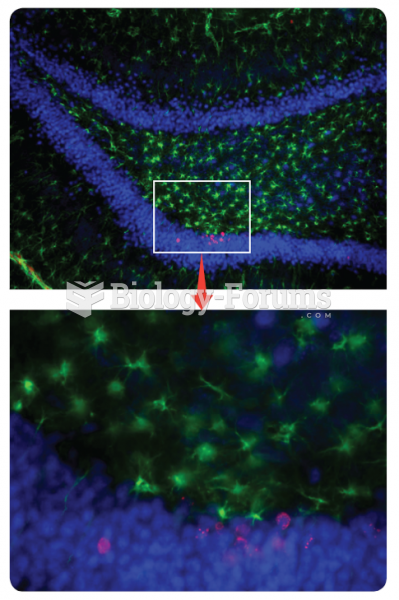 Adult neurogenesis. The top panel shows new cells in the dentate gyrus of the hippocampus—the cell ...
 This image shows the spread of droplets from an uncovered sneeze.
 How to manually solve and graph any quadratic equation
 Graph the function by hand & label key points on graph: