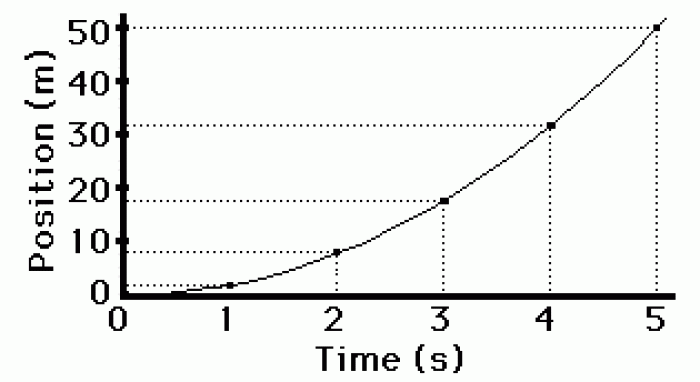
Author Question: The above graph shows that the farther people have to travel, the less likely they are to do so. The ... (Read 115 times)

KimWrice

  • Hero Member
  • *****
  • Posts: 579
The above graph shows that the farther people have to travel, the less likely they are to do so. The inhibiting effect of distance is ascribed to
 
  A) the friction of distance.
  B) the problem of space.
  C) time-space convergence.
  D) cognitive distance.
  E) irredentism.

Question 2

The above map is an example of a(n)
 
  A) isopleth map.
  B) GIS map.
  C) cartogram.
  D) Mercator projection map.
  E) topological map.


paavo

  • Sr. Member
  • ****
  • Posts: 301
Answer to Question 1

Answer: A

Answer to Question 2

Answer: C


Related Topics

Need homework help now?

Ask unlimited questions for free

Ask a Question
 

Did you know?

Medication errors are three times higher among children and infants than with adults.

Did you know?

The senior population grows every year. Seniors older than 65 years of age now comprise more than 13% of the total population. However, women outlive men. In the 85-and-over age group, there are only 45 men to every 100 women.

Did you know?

About 100 new prescription or over-the-counter drugs come into the U.S. market every year.

Did you know?

By definition, when a medication is administered intravenously, its bioavailability is 100%.

Did you know?

Vaccines cause herd immunity. If the majority of people in a community have been vaccinated against a disease, an unvaccinated person is less likely to get the disease since others are less likely to become sick from it and spread the disease.

For a complete list of videos, visit our video library