This topic contains a solution. Click here to go to the answer
|
|
|

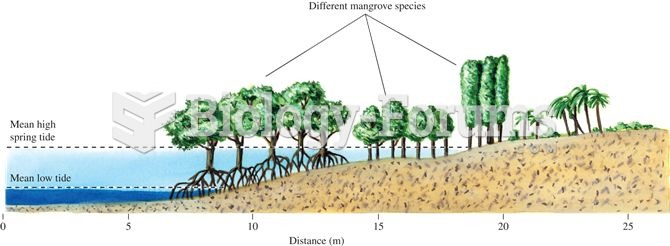 Where mangrove diversity is high, mangrove species show clear patterns of vertical zonation relative
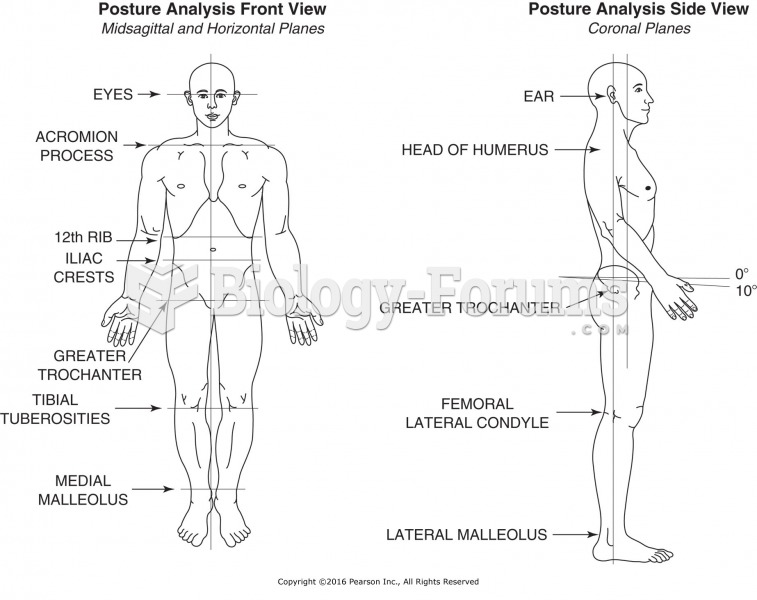 Reference points for posture analysis.
 Use full palms to apply light sliding strokes from foot to hip. This connects and finishes massage ...
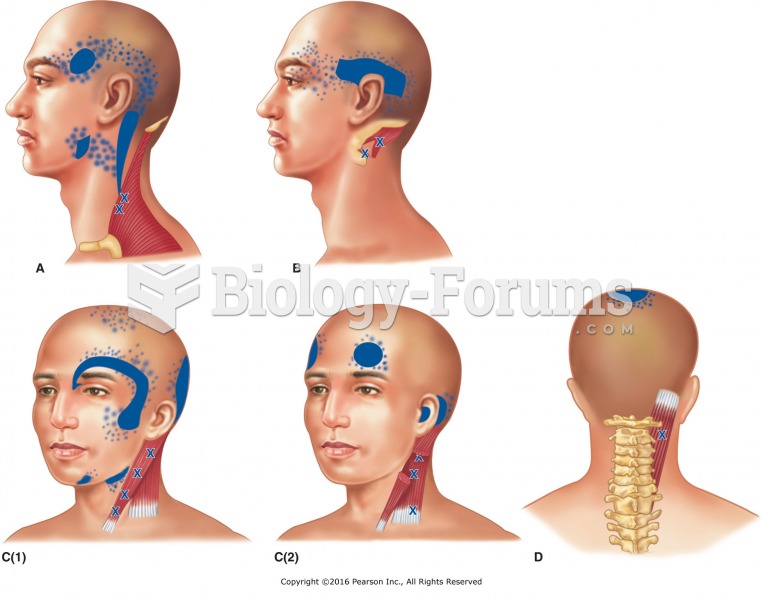 Locations and reference zones of trigger points that cause headaches. A. Upper trapezius. B. ...
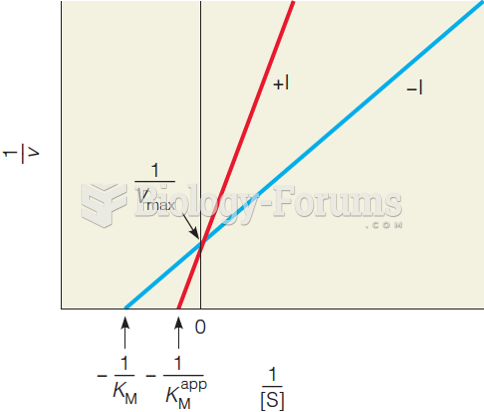 Lineweaver–Burk plots of the reactions with and without a competitive inhibitor
 Trends in employed mothers with a child/children younger than 3 years of age