This topic contains a solution. Click here to go to the answer
|
|
|

 Aerial photo showing the placement of 24 study plots, each 50 m by 50 m, in the Chihuahuan Desert ne
 A lilac, orange and white Satin Peruvian guinea pig (show-length coat)
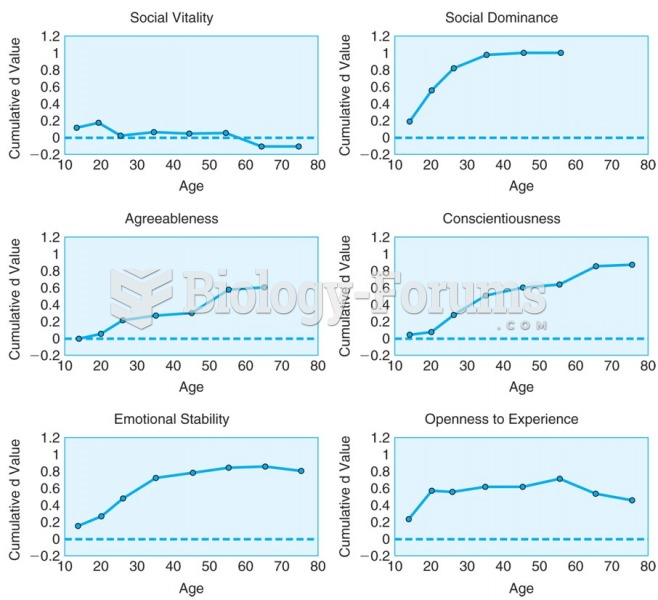 Cumulative change for six personality-trait domains across the life course show distinct patterns.
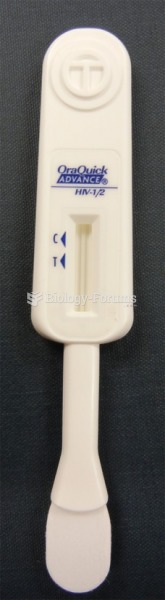 OraQuick. A negative result would show a red line at the "C" mark, whereas a positive ...
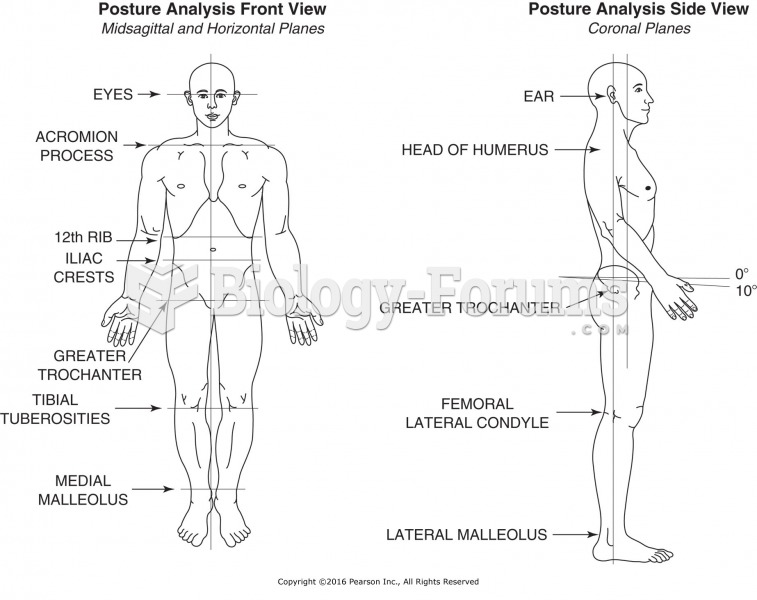 Reference points for posture analysis.
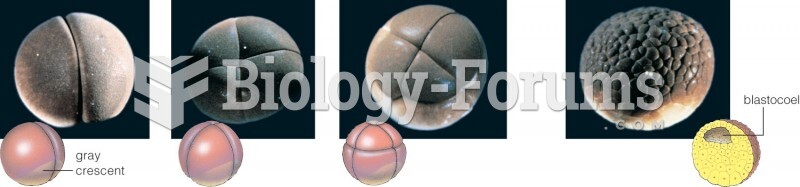 Here we show the first three divisions of cleavage, a process that carves up a zygote’s cytoplasm. ...