This topic contains a solution. Click here to go to the answer
|
|
|

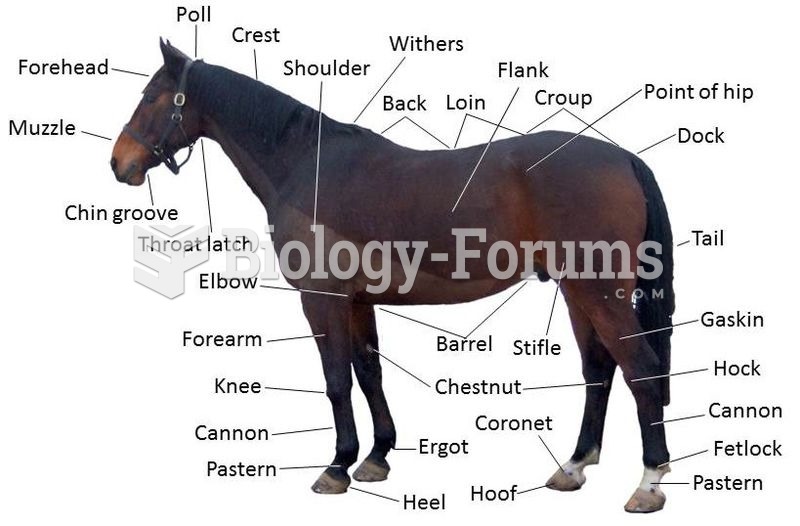 Points of a horse
 Emission Trends
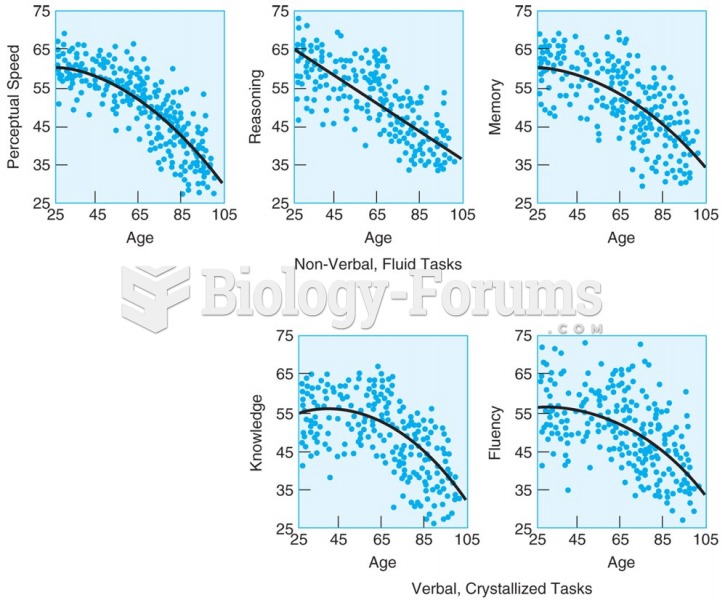 Adults in the Berlin Study of Aging show earlier declines on tests of nonverbal, fluid tasks (upper ...
 Pinch the sternocleidomastoid (SCM) muscle at points along its length. Turn head to side to expose ...
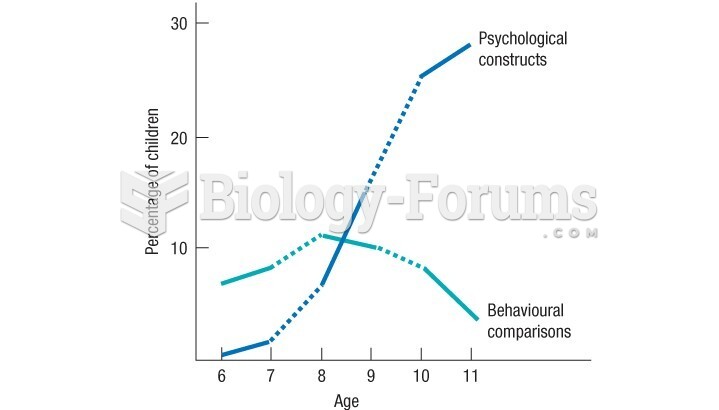 Barenboim's study show the change in children's descriptions of their peers
 Calculus help: Show that y has three points of inflection and they all lie on...