This topic contains a solution. Click here to go to the answer
|
|
|

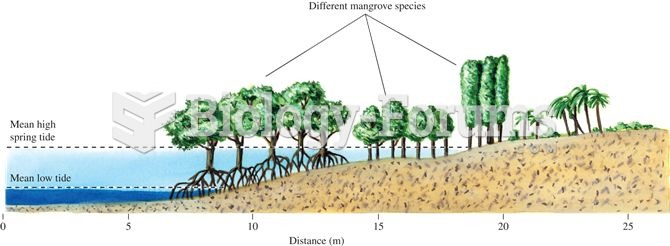 Where mangrove diversity is high, mangrove species show clear patterns of vertical zonation relative
 Large regions of the Boreal forest in Alberta have been divided into a grid due to industrial develo
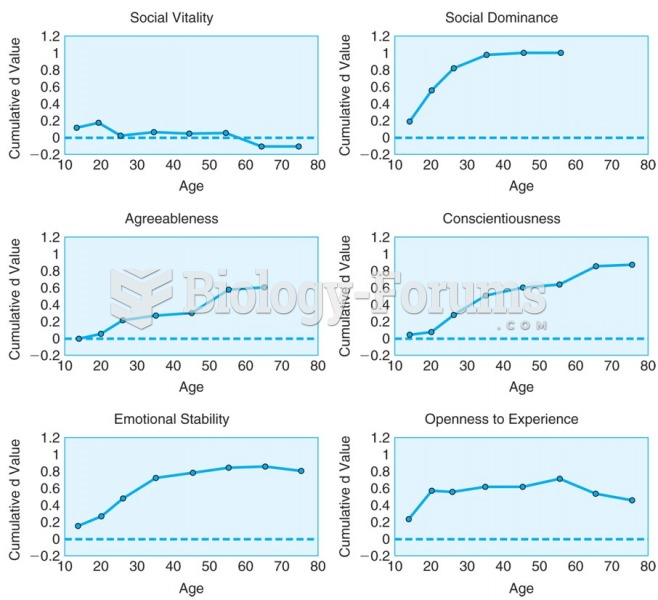 Cumulative change for six personality-trait domains across the life course show distinct patterns.
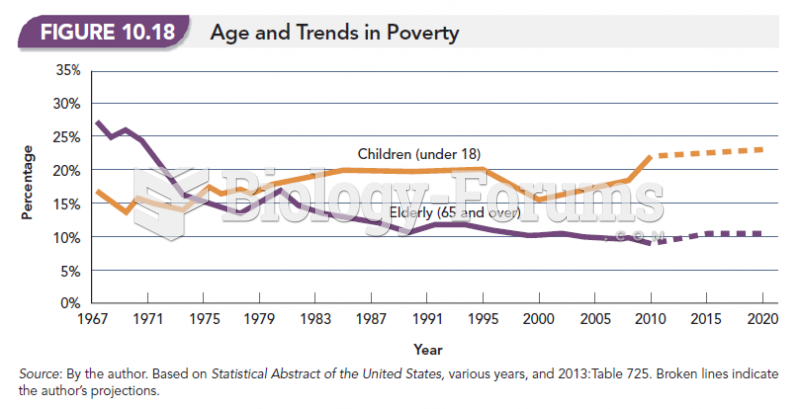 Age and Trends in Poverty
 Apply vibration clockwise around abdomen with fingertips to points in a circle over the colon.
 Graph the function by hand & label key points on graph: