This topic contains a solution. Click here to go to the answer
|
|
|

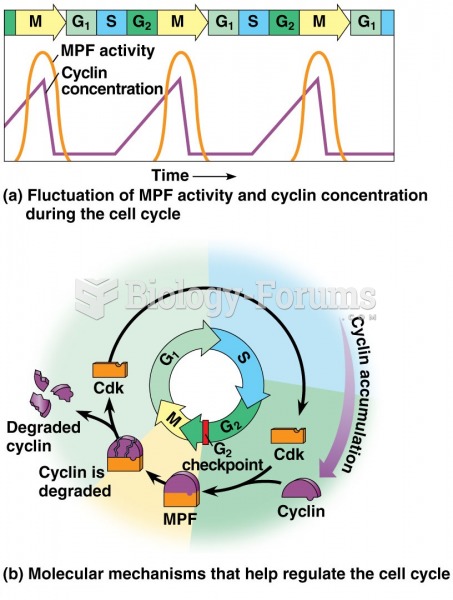 Mitosis + Check Points 4 of 5
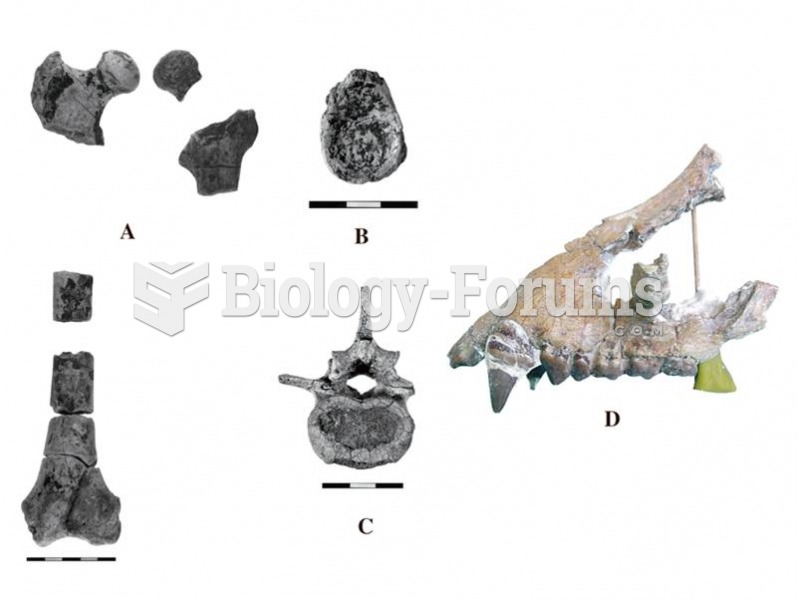 Morotopithecus is the earliest fossil ape to show postcranial adaptations similar to those of the li
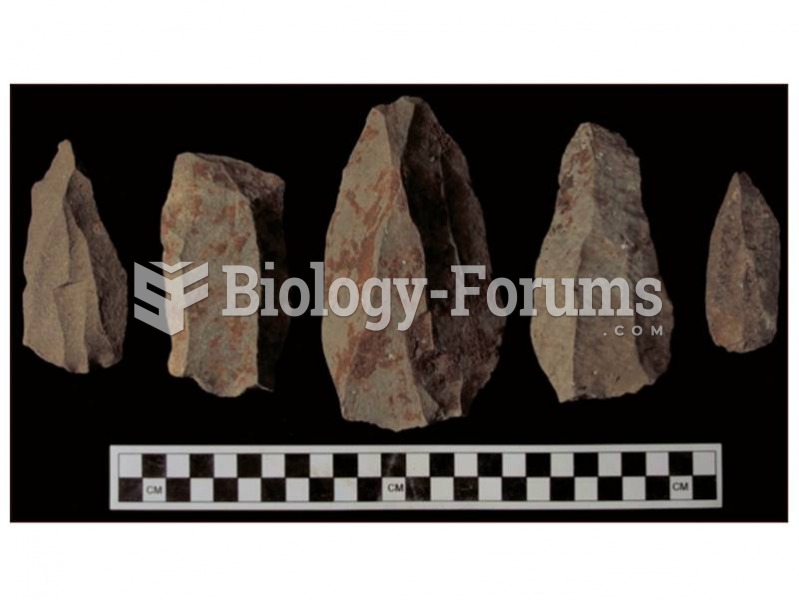 Levallois points and flakes from Kapthurin, Kenya date to between 200,000 and 280,000 years ago.
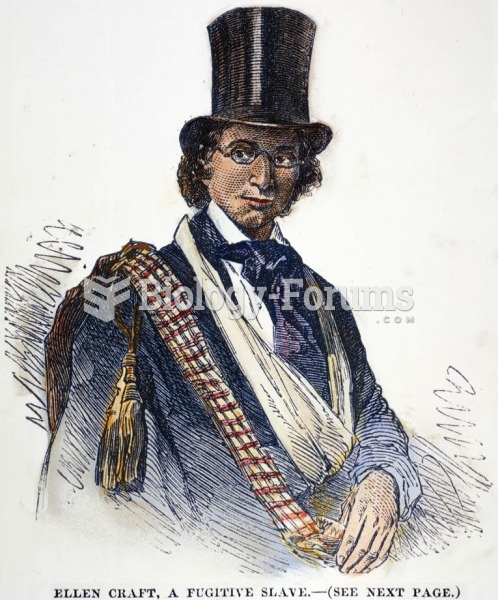 These illustrations show Ellen Craft, a slave with and without a disguise. She dressed “as a disting
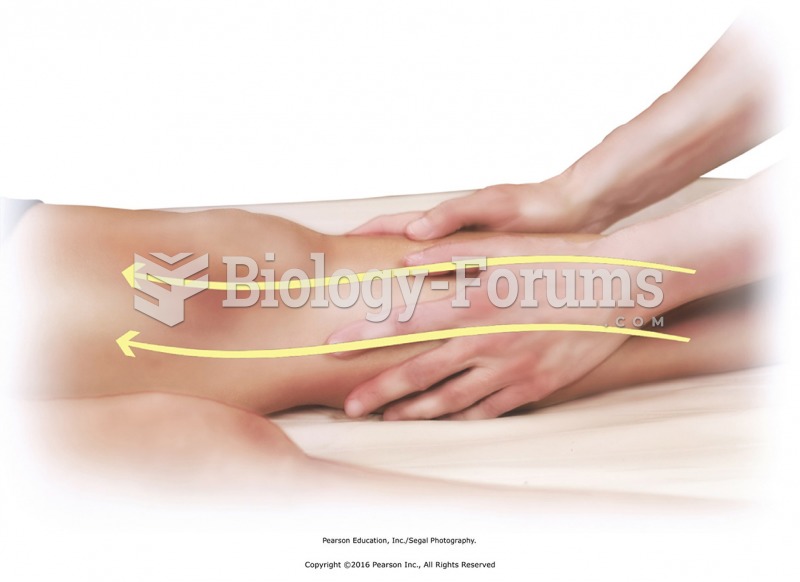 Use full palms to apply light sliding strokes from foot to hip. This connects and finishes massage ...
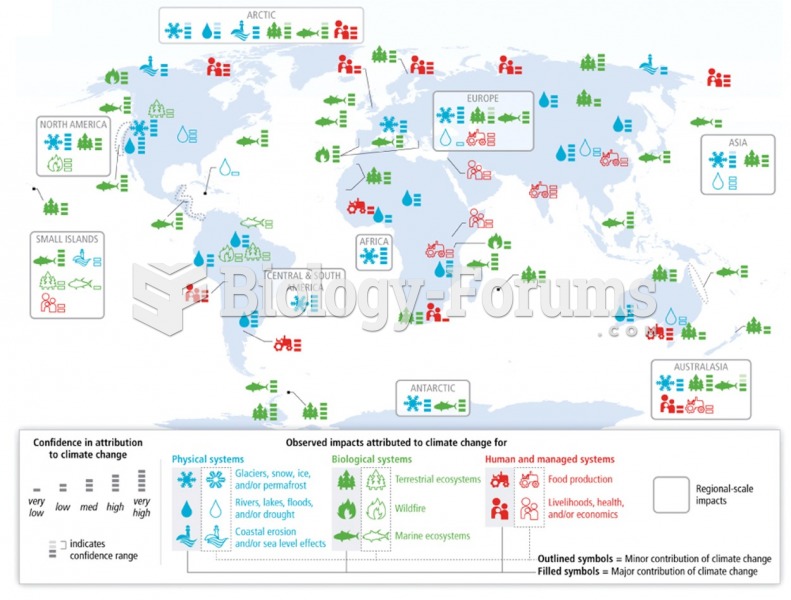 Current and future trends and impacts (IPCC)