This topic contains a solution. Click here to go to the answer
|
|
|

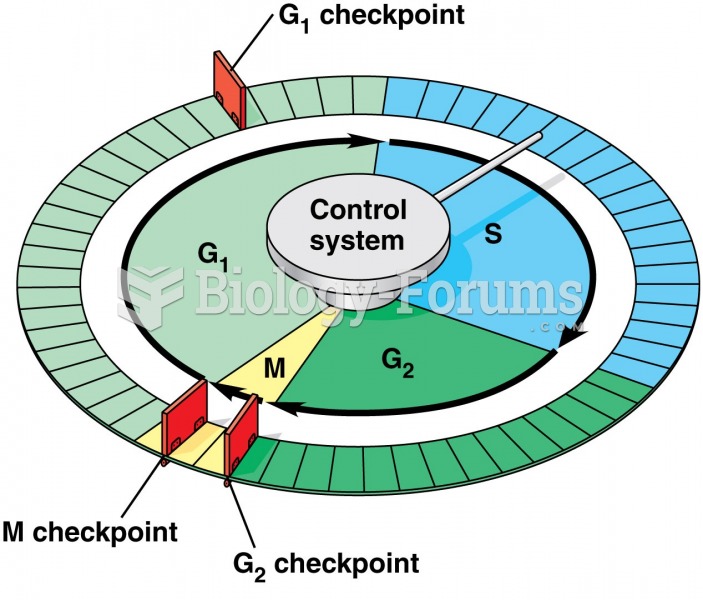 Mitosis + Check Points 2 of 5
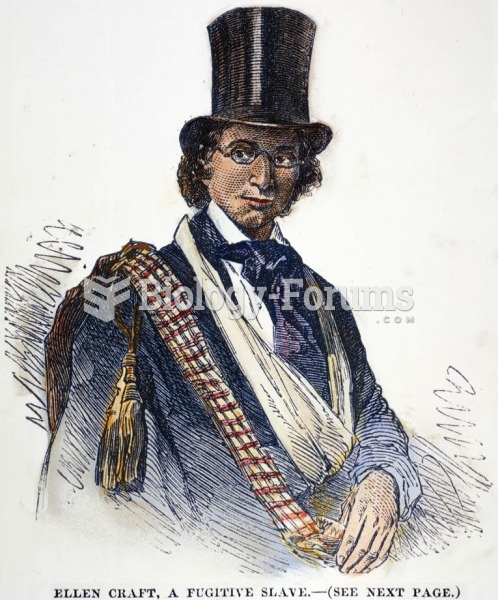 These illustrations show Ellen Craft, a slave with and without a disguise. She dressed “as a disting
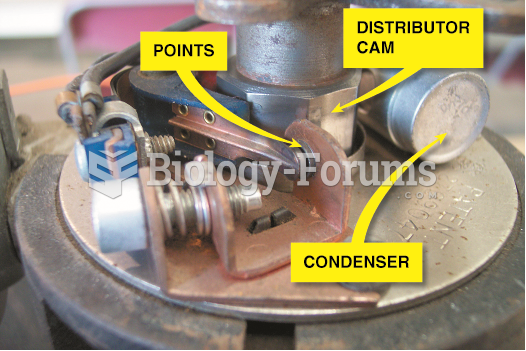 A point-type ignition system showing the distributor cam which opens the points
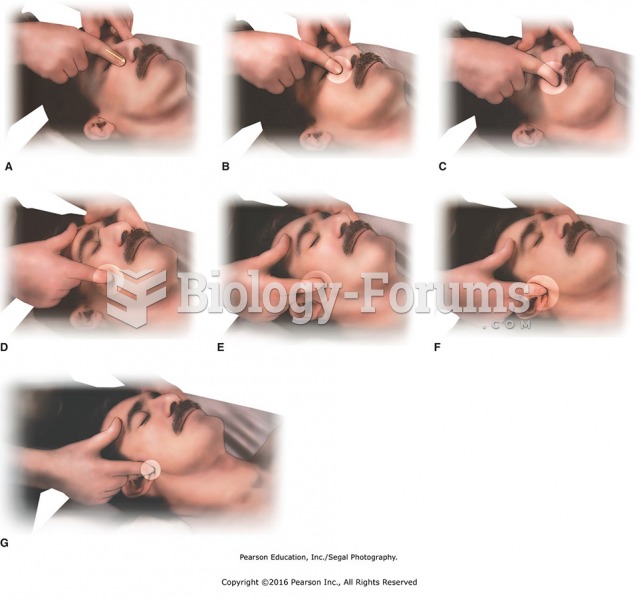 (A) Thumb slide down nose to (B) St-2. Press points along the cheekbone: (C) LI-20, (D) St-3, (E) ...
 Graph the function by hand & label key points on graph:
 BOILING POINTS