This topic contains a solution. Click here to go to the answer
|
|
|

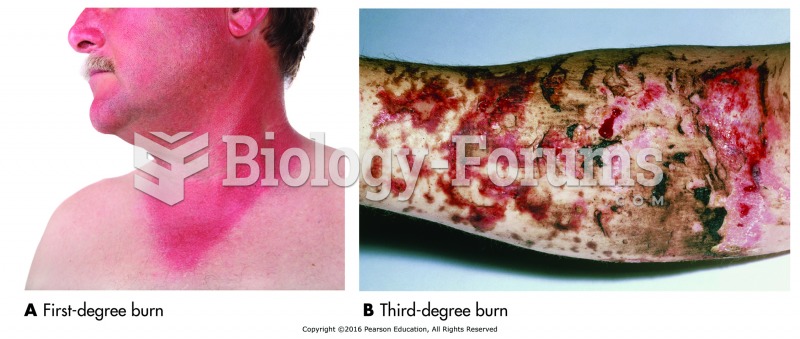 Assessing the degree of the burn. Bottom photos show (A) first-degree burn (sunburn) and (B) ...
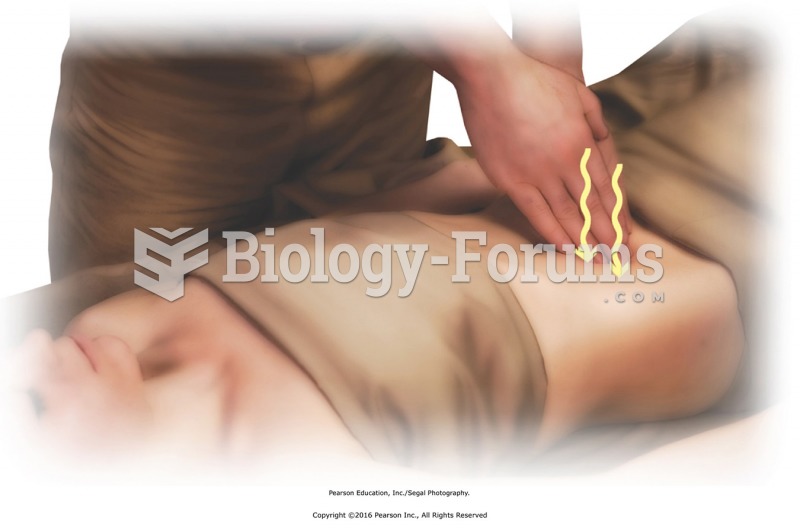 Apply vibration clockwise around abdomen with fingertips to points in a circle over the colon.
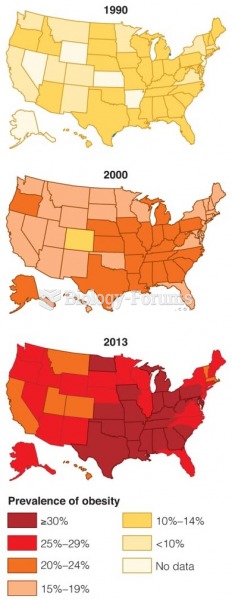 Obesity Trends among U.S. Adults Over the last two decades
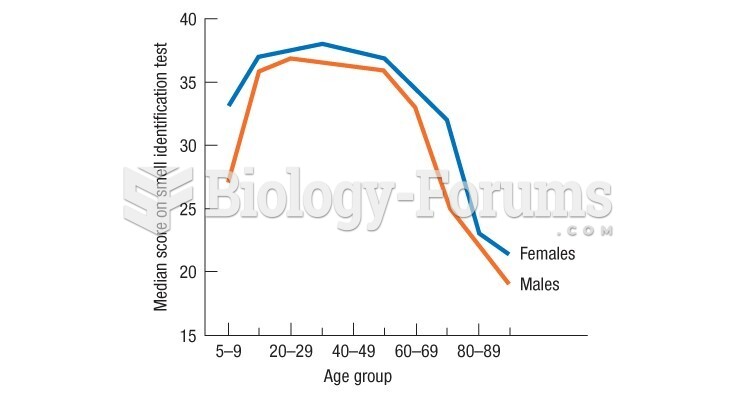 Doty's data show a very rapid drop in late adulthood in the ability to identify smells
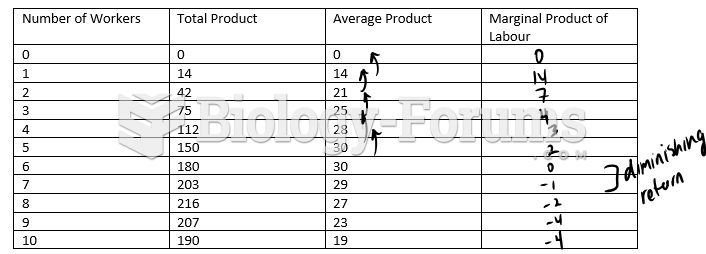 Complete the following production chart and plot the points.
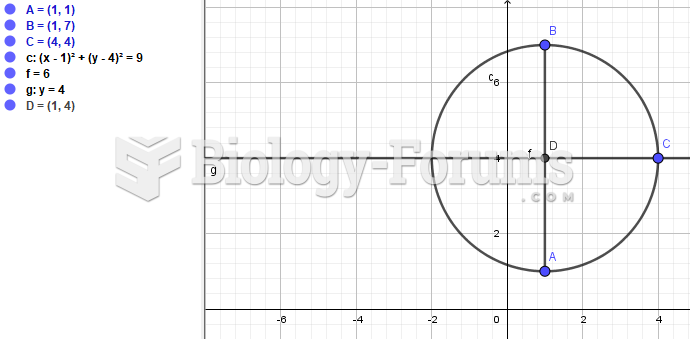 A piece of broken plate was dug up in an archeological site. It was put on top of the grid ...