This topic contains a solution. Click here to go to the answer
|
|
|

Did you know?
Methicillin-resistant Staphylococcus aureus or MRSA was discovered in 1961 in the United Kingdom. It if often referred to as a superbug. MRSA infections cause more deaths in the United States every year than AIDS.

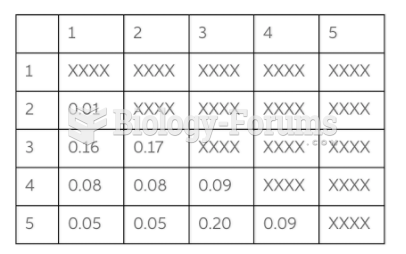
 The b-galactosdase chart
 A beam-type torque wrench that displays the torque reading on the face of the dial. The beam display ...
 Chart
Chart
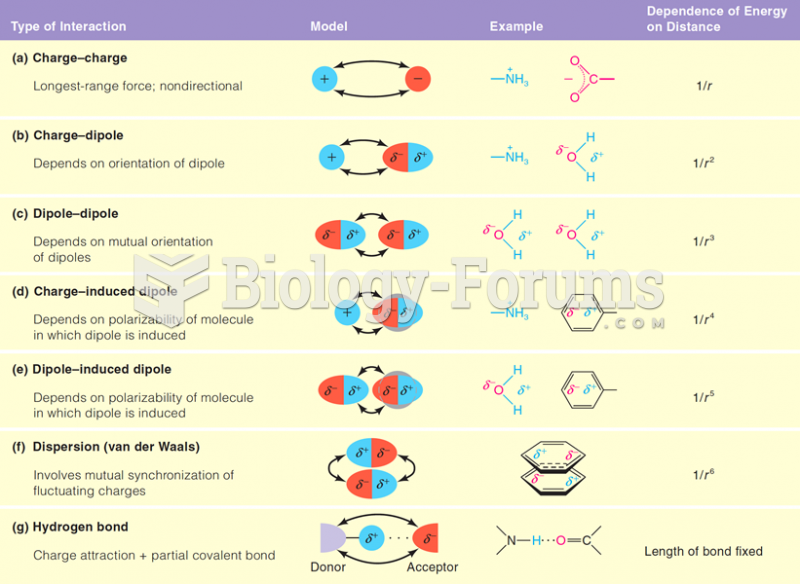 Type of Interactions, Model, Examples and Dependence of Energy on Distance
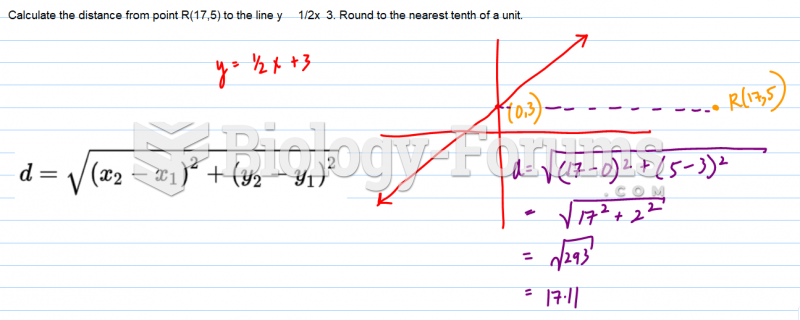 Calculate the distance from point R(17,5) to the line ... Round to the nearest tenth of a
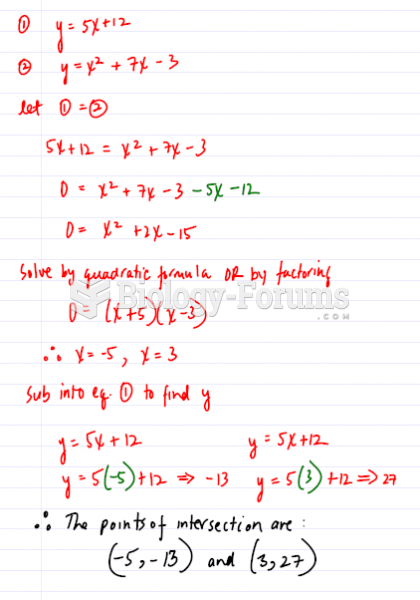 The line with the equation y=5x+12 intersects the parabola with equation y=xsqared+7x-3 at the ...