This topic contains a solution. Click here to go to the answer
|
|
|

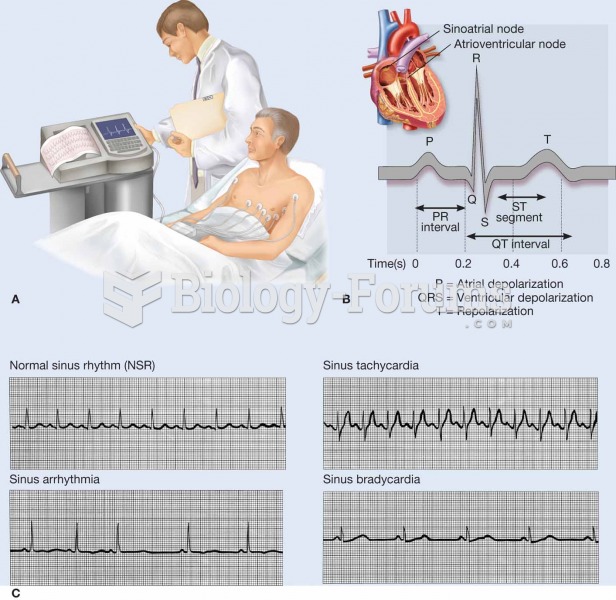 An electrocardiogram (ECG, EKG) is a commonly used procedure in which the electrical events associat
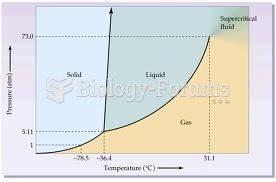 Carbon Dioxide Phase Diagram
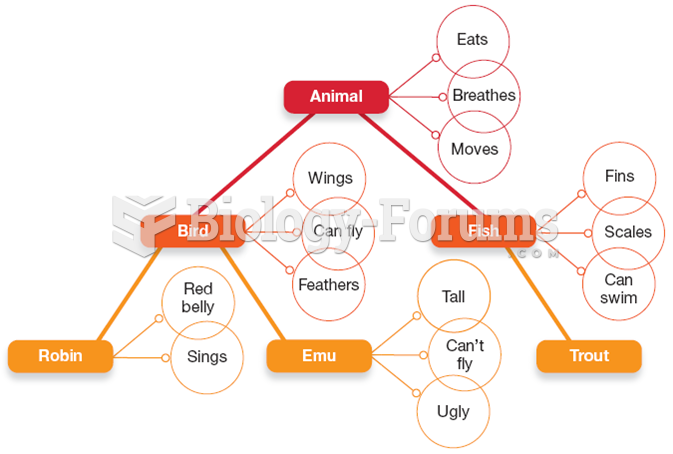 A Semantic Network Diagram for the Category “Animal”
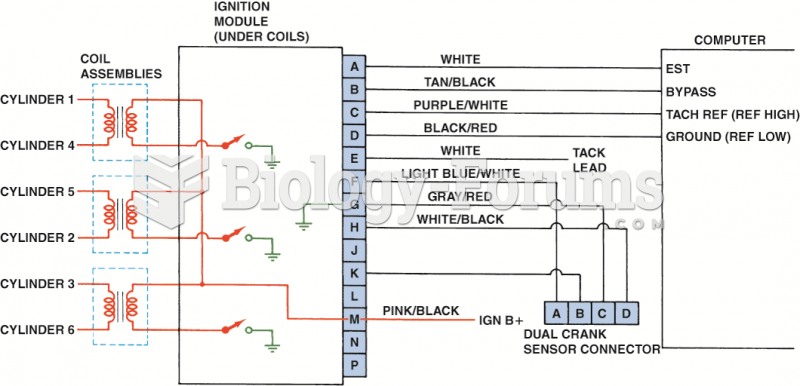 Typical wiring diagram of a V-6 distributorless (direct fire) ignition system.
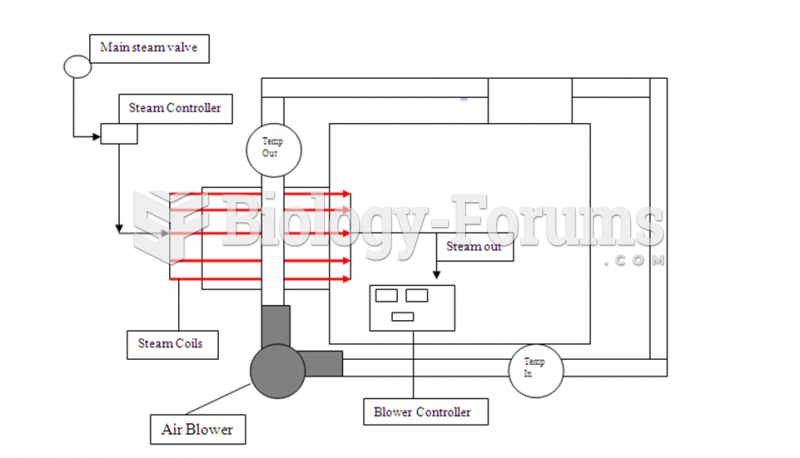 Diagram of Cross Flow Air Dryer
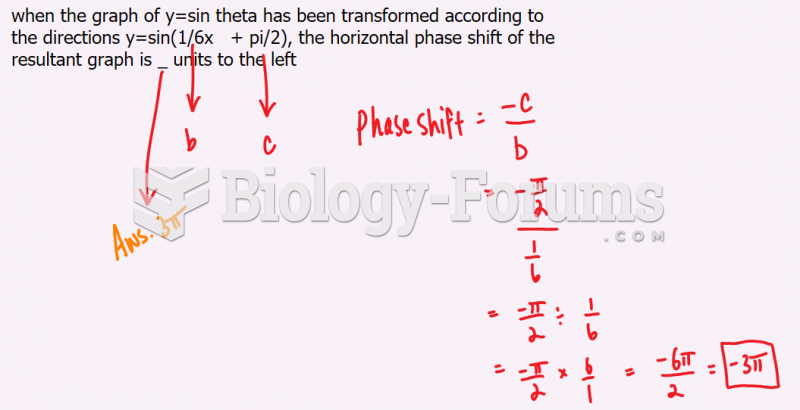 The horizontal phase shift of the resultant graph is