This topic contains a solution. Click here to go to the answer
|
|
|

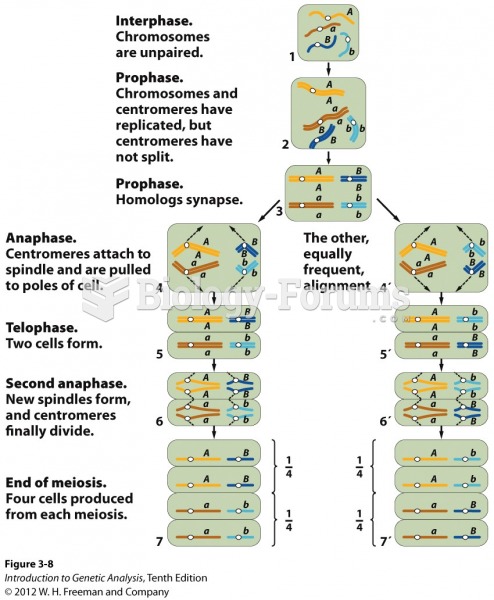 Independent assortment of chromosomes at meiosis explains Mendel’s ratio
 Closed urinary drainage system. Urine being measured after it leaves patient’s body via catheter.
 Solar particles interact with Earth's magnetosphere. Sizes not to scale.
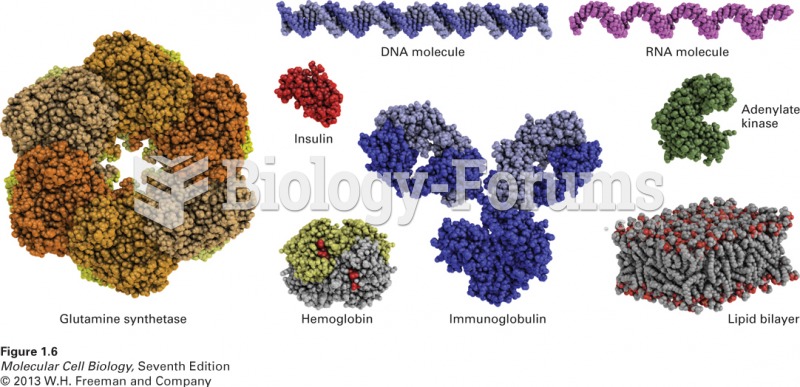 Models of some representative proteins drawn to a common scale
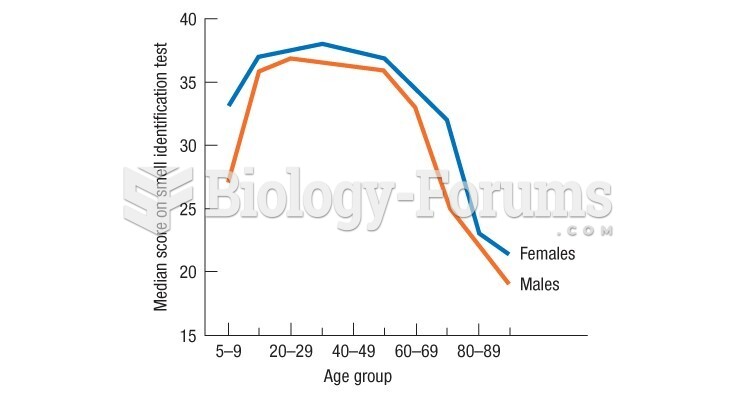 Doty's data show a very rapid drop in late adulthood in the ability to identify smells
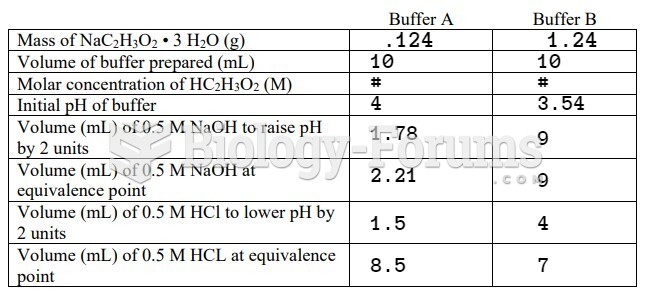 data
data