This topic contains a solution. Click here to go to the answer
|
|
|

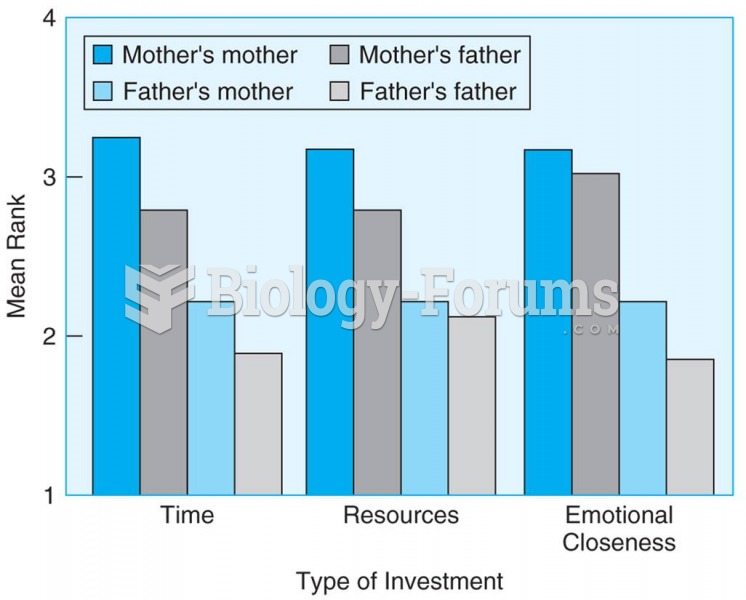 Students rated their grandparents on a scale from 1 to 4 based on emotional closeness, time spent ...
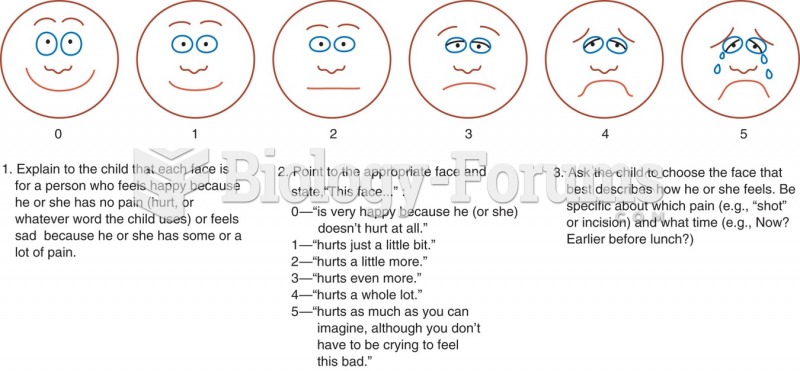 The Wong/Baker FACES rating scale.
 Sequential blending uses a computer to calculate the correct ratio as well as the prescribed order ...
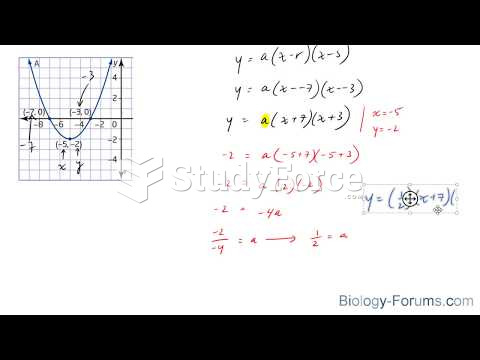 How to determine an equation in factored form from a graphed parabola
 Continuous capillaries
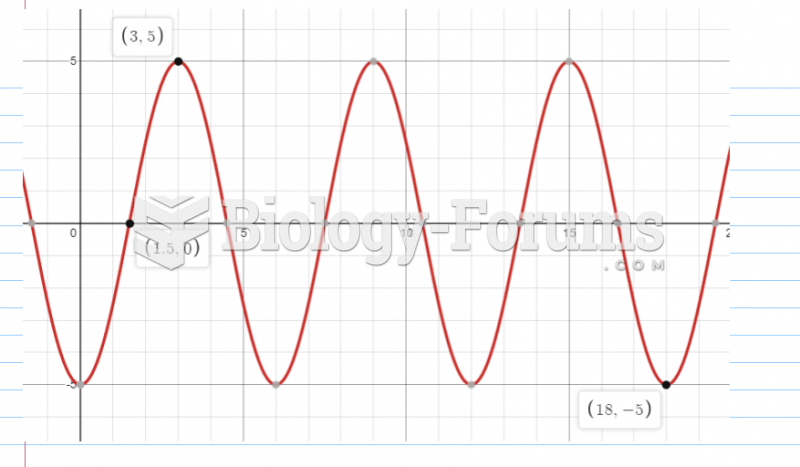 Sketch a graph of the function h(x), by hand on the following interval: