This topic contains a solution. Click here to go to the answer
|
|
|

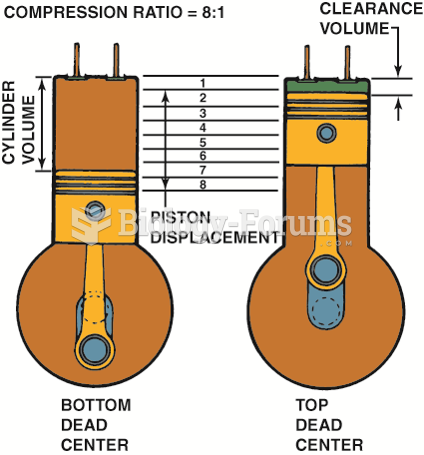 Compression ratio is the ratio of the total cylinder volume (when the piston is at the bottom of ...
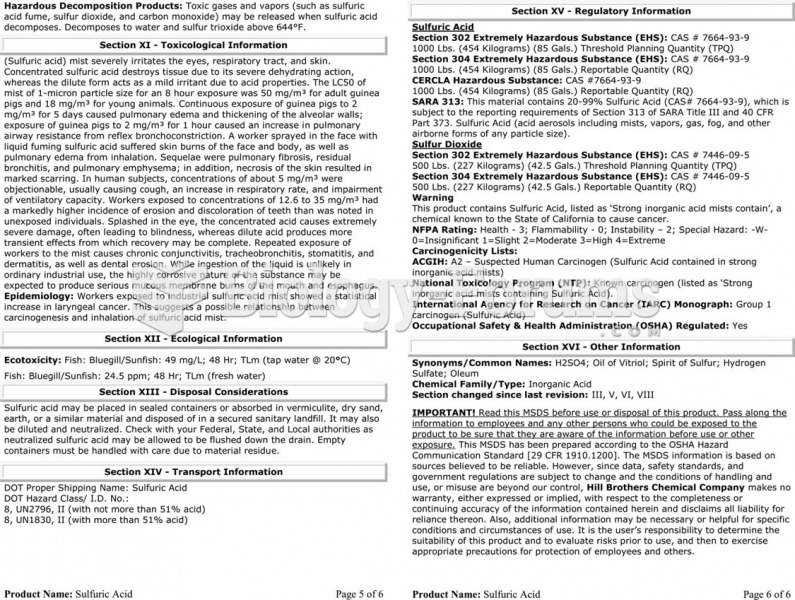 The material safety data sheet (MSDS) for sulfuric acid showing the detailed technical information ...
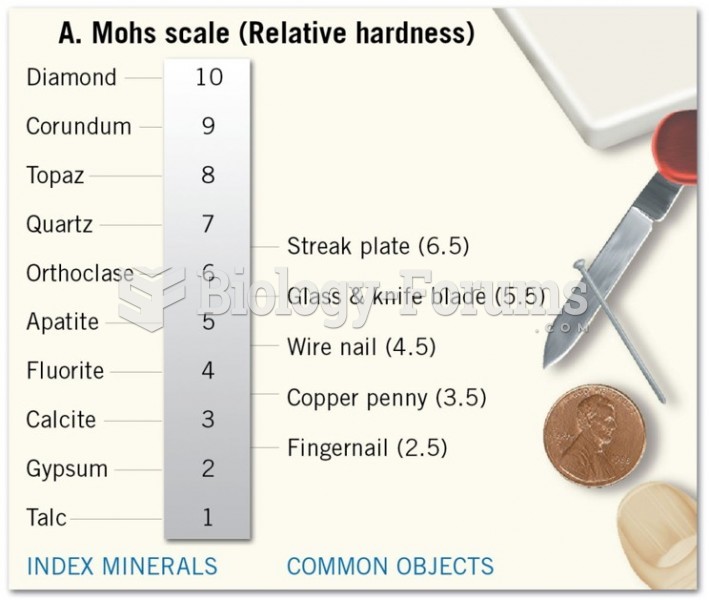 Hardness: Mohs Scale (1 of 2)
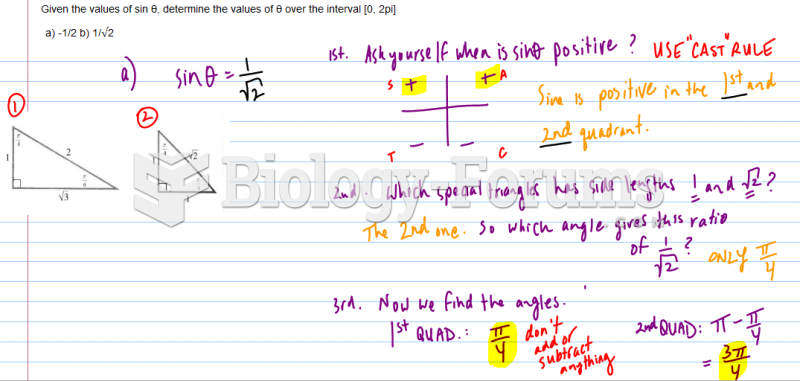 Finding the angle from a ratio
 Data management questions
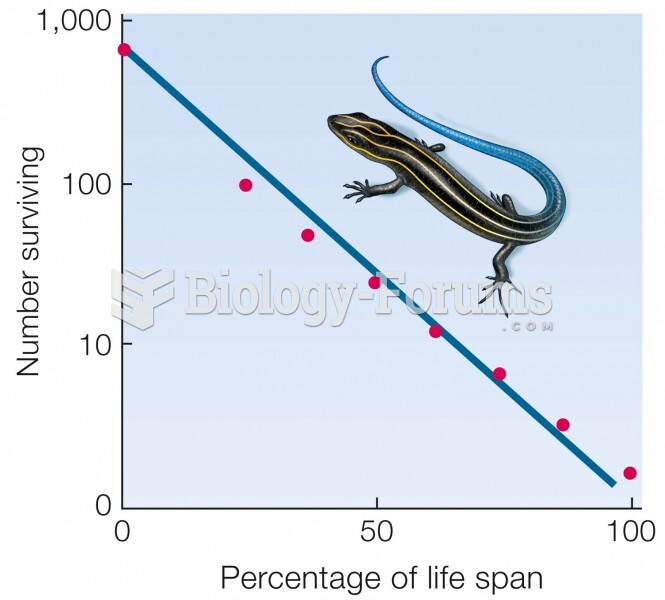 Type II curve. Mortality does not vary with age. Data for five-lined skink (Eumeces fasciatus).