This topic contains a solution. Click here to go to the answer
|
|
|

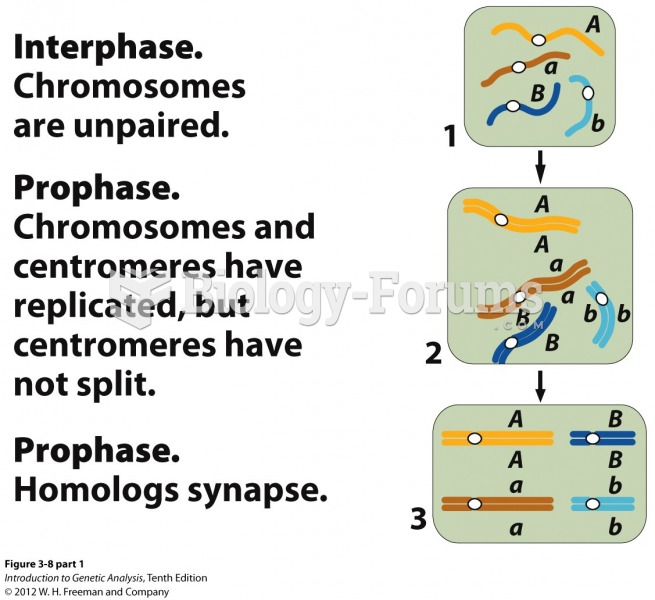 Independent assortment of chromosomes at meiosis explains Mendel's ratio
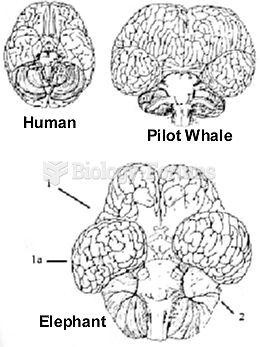 Human, pilot whale and elephant brains up to scale. (1)-cerebrum (1a)-temporal lobe and (2)-cerebell
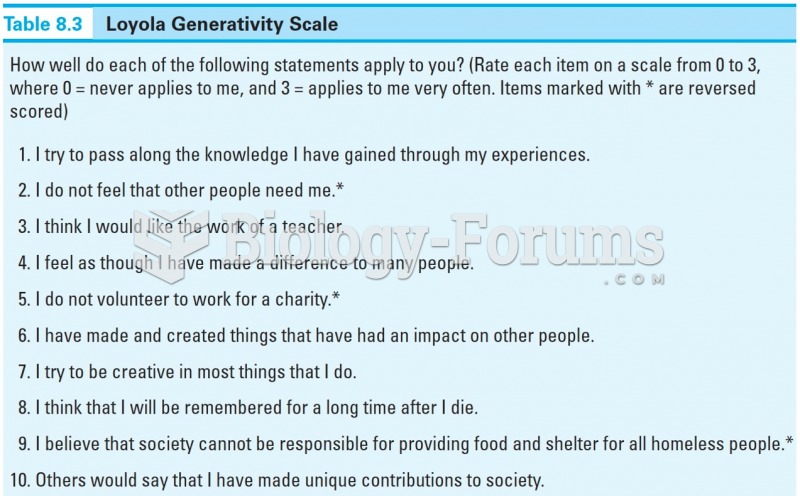 Loyola Generativity Scale
 International Normalized Ratio Guidelines for Dental Treatment
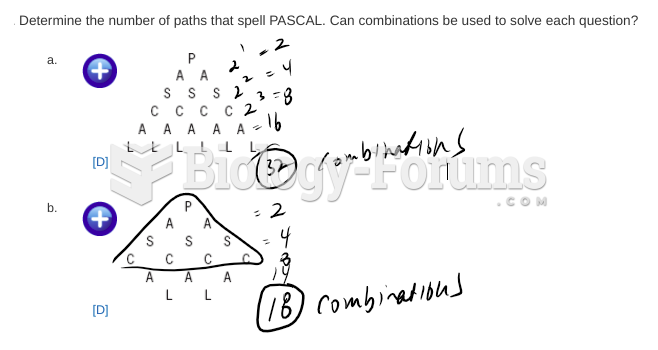 Data management questions
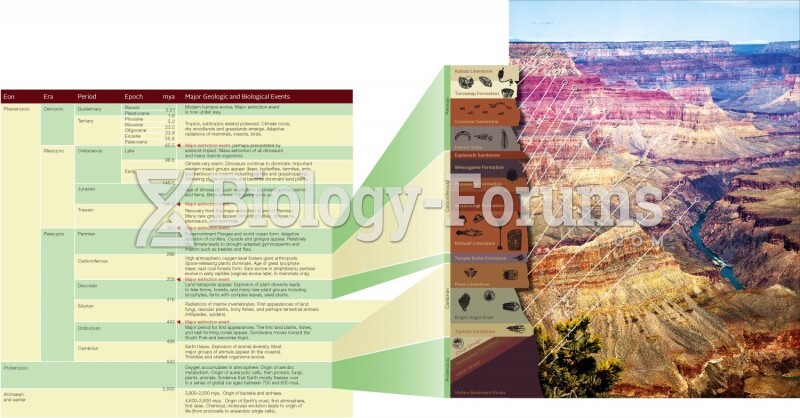 The Geologic Time Scale