This topic contains a solution. Click here to go to the answer
|
|
|

 Major features of the Solar System (not to scale)
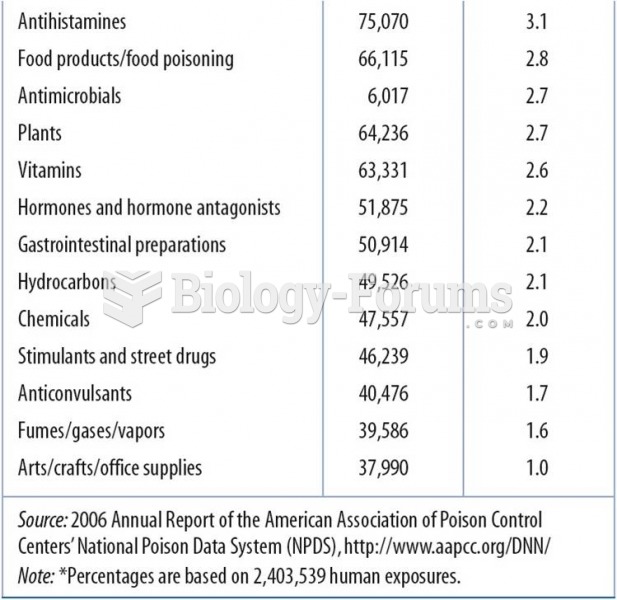 2006 Data:Top 25 Substances Involved in Human Exposures
 How to find the quartiles and percentiles for a data set
 Measuring the client’s height with a platform scale
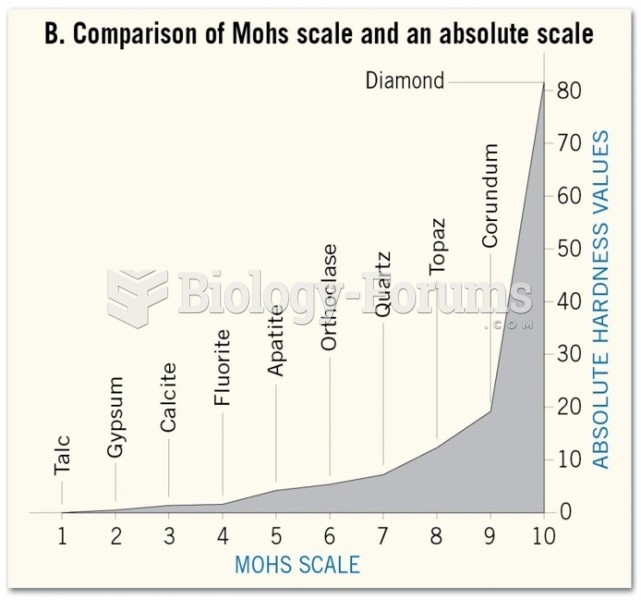 Hardness: Mohs Scale (2 of 2)
![Given the values of sin θ, determine the values of θ over the interval [0, 2pi]](https://biology-forums.com/gallery/42/medium_6_04_01_21_12_54_15.png) Given the values of sin θ, determine the values of θ over the interval [0, 2pi]
Given the values of sin θ, determine the values of θ over the interval [0, 2pi]