This topic contains a solution. Click here to go to the answer
|
|
|

 A pair of kiangs
 A physician uses a portable electronic tablet to enter patient data while in the examination room.
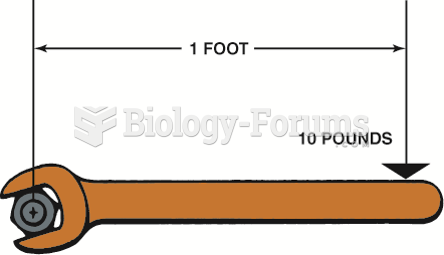 Torque is a twisting force equal to the distance from the pivot point times the force applied ...
 Finger pressure to a trigger point.
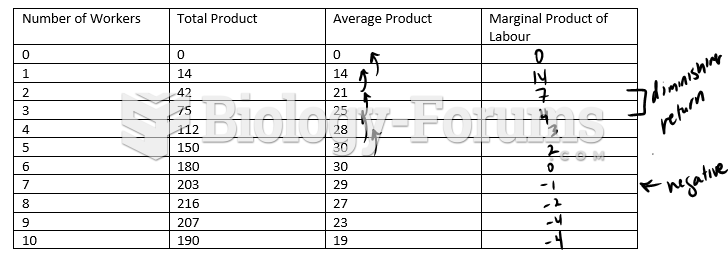 Complete the following production chart and plot the points.
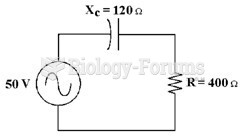 If the frequency equals 60 Hz in Figure 10-1, what is the value of capacitance?