|
|
|

 Drugs and their effect table
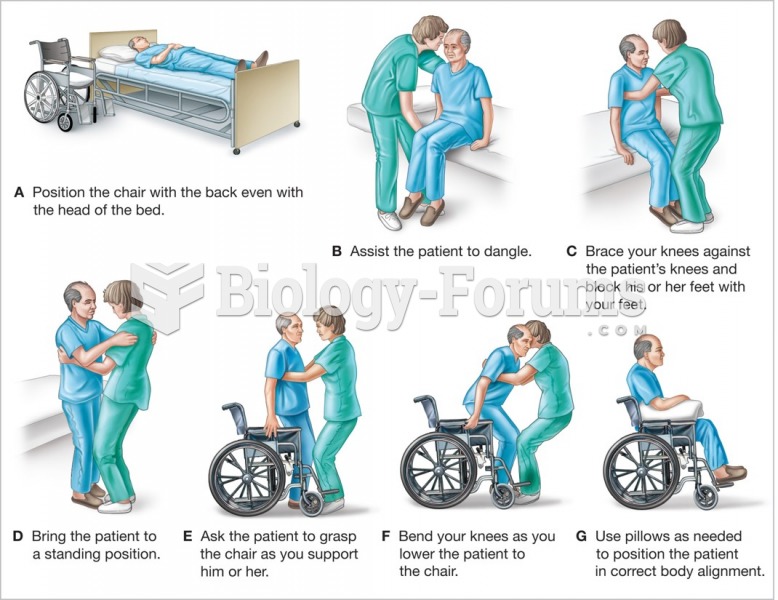 Assisting the patient to transfer from the bed or examining table to a wheelchair.
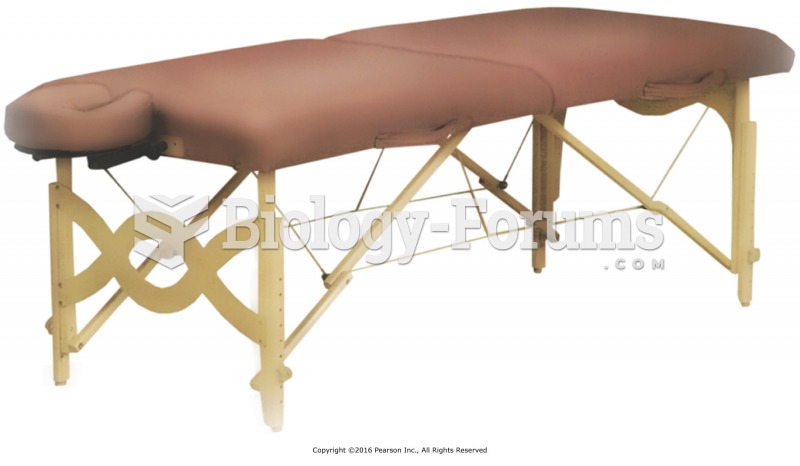 Adjustable massage table with face cradle.
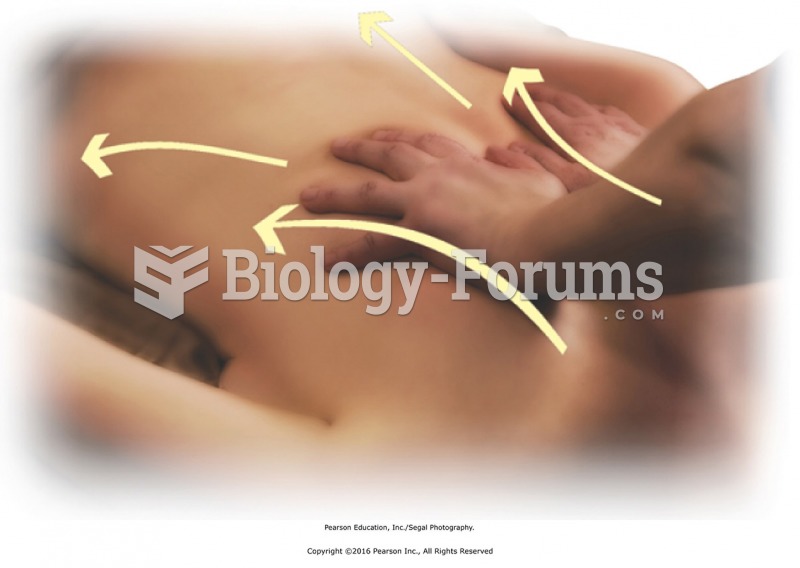 Finish with bilateral stroking to the entire back. Stand at head of the table with fingers pointing ...
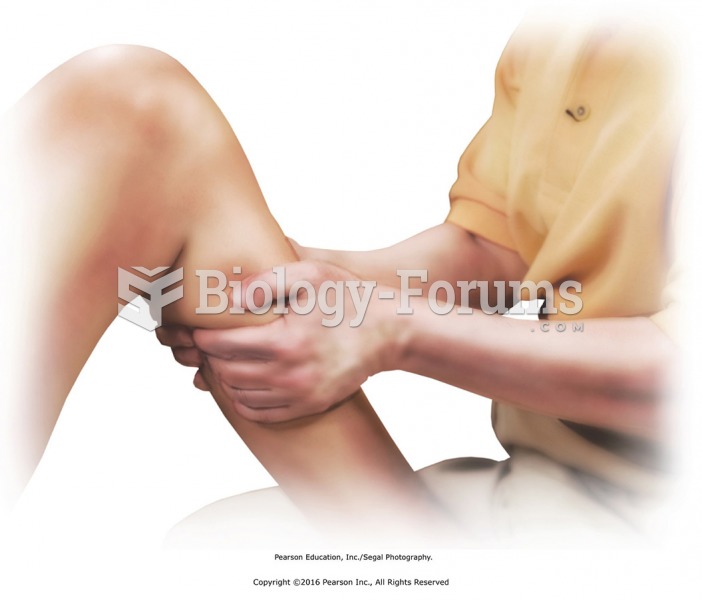 Knead the calf muscles with both hands. Place the foot flat on the table, knee bent. Reach behind ...
 Table - Correlation Analysis